World Maps PowerPoint Template for Pros


Imagine transforming dry geographic data into a compelling story that captivates your audience from the first slide. This World Maps PowerPoint Template equips you with stunning, editable diagrams to showcase global trends, market expansions, or educational explorations effortlessly. Designed for professionals who need to convey complex international information with clarity and impact, it`s your shortcut to presentations that resonate worldwide.
Whether you`re pitching a new overseas venture to stakeholders or teaching students about continental divides, these high-quality maps bring your narrative to life. Fully compatible with PowerPoint 2016 and later versions, the template offers a one-time purchase of $16 for lifetime access, ensuring you invest once and create endlessly. Dive in and see how easy it is to customize colors, add pins for key locations, or integrate data charts - all without starting from scratch.
Discover the Power of Editable Global Visuals
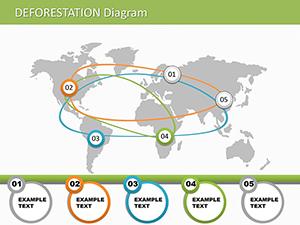
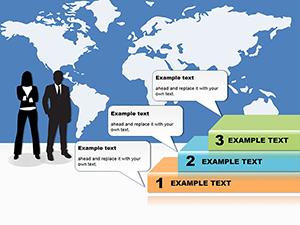
At its core, this template revolutionizes how you handle spatial data in presentations. Gone are the days of pixelated clipart or time-consuming custom designs. Instead, you`ll find eight meticulously crafted slides featuring detailed continent outlines and country-specific views. Each map is vector-based, scaling perfectly for any screen size, and includes interactive elements like customizable markers and overlay graphs.
What sets this apart from default PowerPoint tools? While built-in shapes often feel rigid and uninspired, these diagrams flow seamlessly with your content. Adjust fonts to match your brand, tweak hues for thematic consistency, or layer in statistics via integrated charts. It`s not just about looks - it`s about making your message stick. Professionals report up to 30% higher engagement when visuals like these anchor their talks.
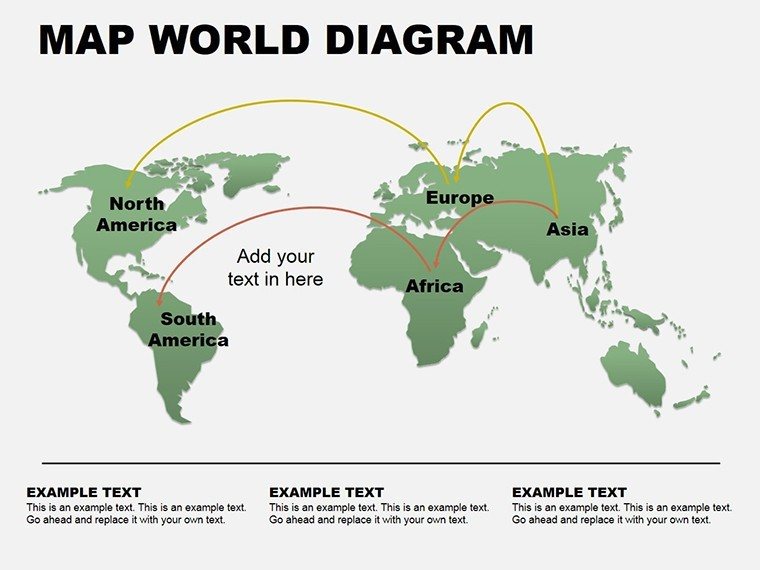
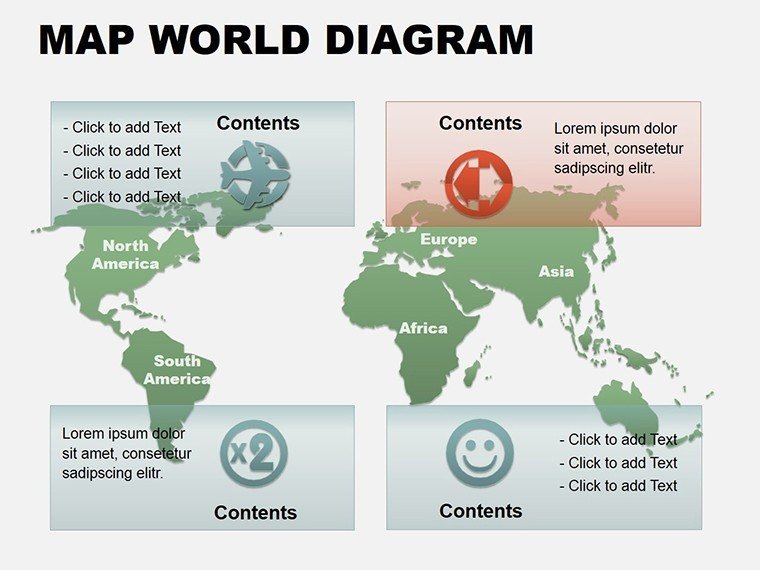
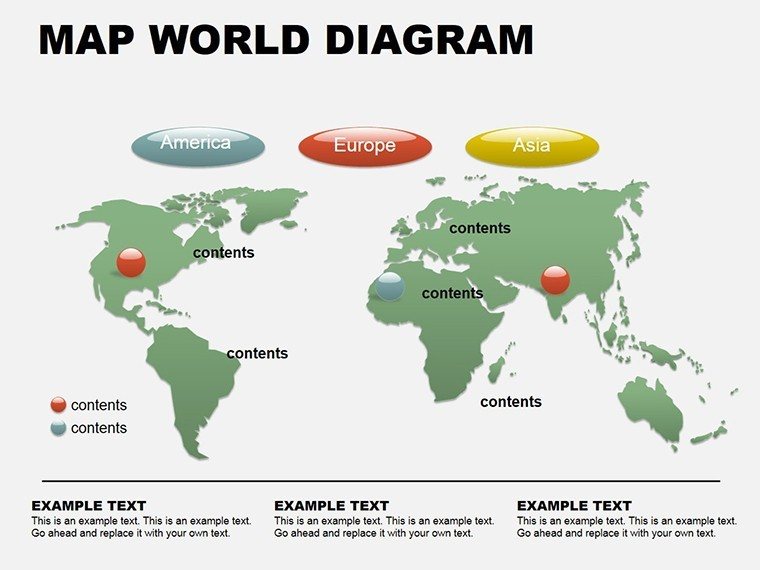
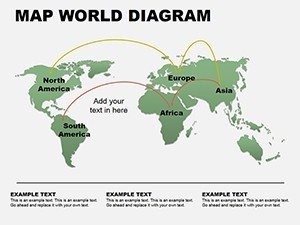
- Continent-Focused Slides: Seven dedicated layouts cover Africa, Asia, Europe, North America, South America, Australia, and Antarctica, each with region-highlighting tools for targeted emphasis.
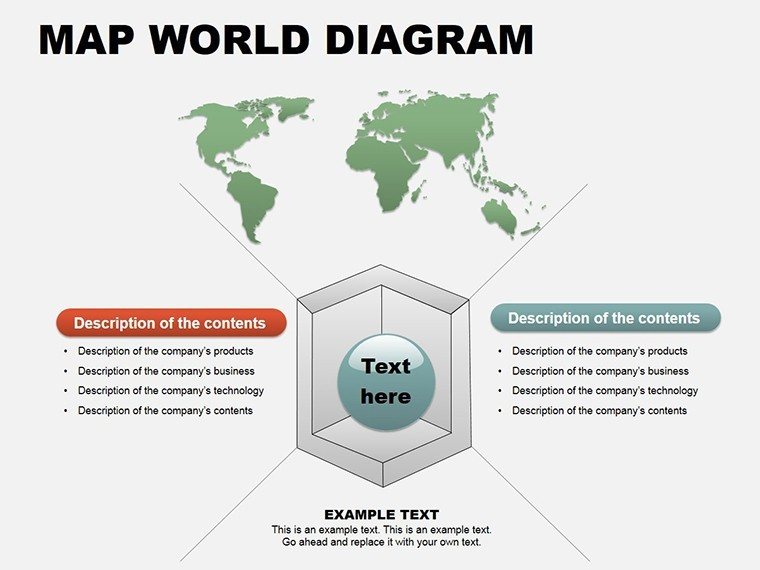
- Country-Level Detail: Zoom into specifics with editable boundaries for major nations, perfect for case studies on trade routes or cultural hotspots.
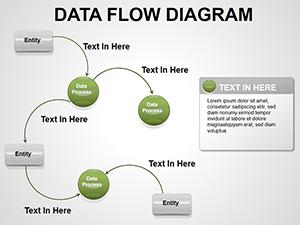
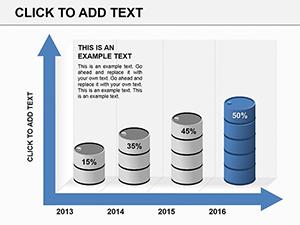
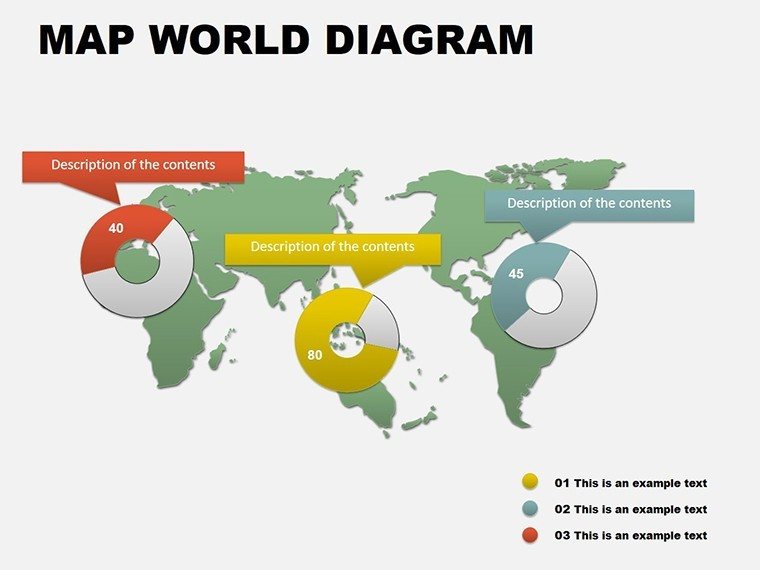
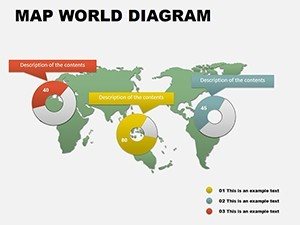
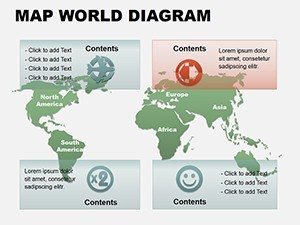
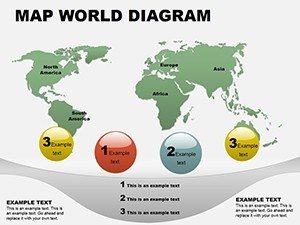
- Data Integration: Built-in pie charts and bar graphs that sync with map elements, turning raw numbers into geographic stories.
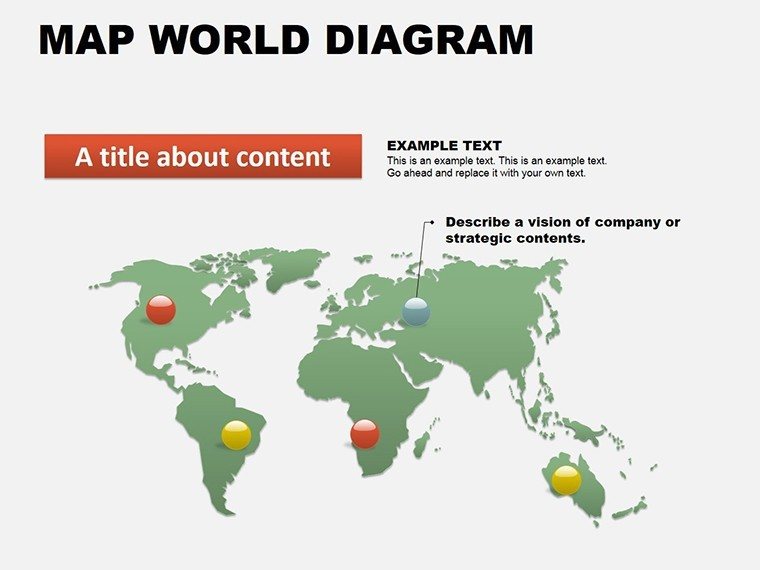
- Interactive Pins: Drop-and-drag markers to flag events, sales territories, or historical sites, enhancing interactivity during live sessions.
Customization is a breeze: right-click any element to edit, and watch as animations subtly reveal layers for dramatic effect. This isn`t generic cartography - it`s tailored for real-world impact, saving you hours per project.
Real-World Applications That Drive Results
Picture this: A marketing director unveiling expansion plans across Europe. With this template, she overlays sales projections on a crisp map, using color gradients to show growth hotspots. The board nods in approval, questions turn to enthusiasm, and the deal closes faster. That`s the tangible value here - turning abstract strategies into visual roadmaps.
In education, teachers use these slides to make geography lessons unforgettable. Highlight migration patterns on an Asia map or climate zones in Africa, complete with student-prompting questions embedded in notes. Parents rave about how kids retain more when lessons feel like adventures, not rote memorization.
For travel agencies, it`s a game-changer. Craft itineraries with pinned destinations on a world overview, linking to cost breakdowns via connected tables. Clients book on the spot, drawn in by the vivid, professional polish that screams expertise.
Business Strategy Sessions
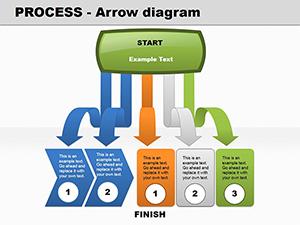
Leverage global maps to dissect supply chains or competitor landscapes. Compare market shares visually across continents, fostering data-driven discussions that propel your team forward.
Educational Workshops
From high school curricula to corporate training, these diagrams simplify complex topics like geopolitical shifts or environmental impacts, keeping learners hooked.
Tourism and Event Planning
Map out routes, venues, and attendee flows with precision, ensuring your proposals stand out in a crowded field.
Compared to stock PowerPoint maps, which lack depth and editability, this template shines by offering thematic versatility. No more wrestling with alignment issues or bland fills - everything aligns intuitively, letting you focus on your story.
Seamless Integration and Pro Tips
Integrating this into your workflow is straightforward. Download the .potx file, open in PowerPoint, and import slides via the Reuse Slides pane. For advanced users, embed hyperlinks to external data sources, turning static maps into dynamic dashboards.
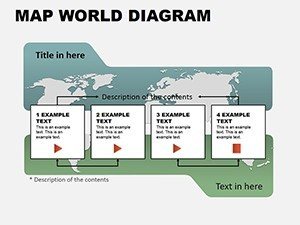
Pro tip: Pair continent slides with timeline overlays for historical context, like tracing trade evolution from ancient routes to modern hubs. This layered approach not only informs but inspires, elevating your presentation from good to unforgettable.
Ready to map out your success? Download the World Maps PowerPoint Template today and start crafting visuals that span the globe.
Frequently Asked Questions
What versions of PowerPoint does this template support?
This template is fully compatible with PowerPoint 2016, 2019, 2021, and Microsoft 365, ensuring smooth performance across platforms.
Can I use these maps for commercial projects?
Yes, with your one-time purchase, you receive a lifetime commercial license for unlimited use in professional settings.
How many slides are included, and are they all editable?
The package features eight fully editable slides, from basic world overviews to detailed regional breakdowns.
Is there support for adding my own data visualizations?
Absolutely - seamlessly integrate charts, graphs, and tables that link directly to map elements for cohesive storytelling.
What if I need maps for specific countries not highlighted?
While focused on continents and major regions, the vector tools allow easy customization to include any country boundaries.
Does the template include animation options?
Yes, subtle entrance and emphasis animations are pre-set, but you can customize or remove them to fit your style.