Stands PowerPoint Charts

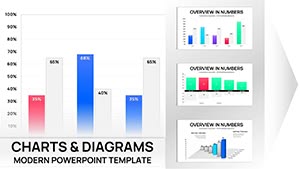
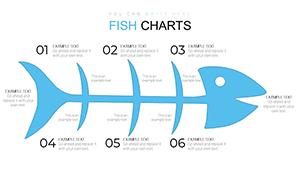
Command the room with stands charts templates for PowerPoint, suited for executives, analysts, and presenters illustrating standings, priorities, and growth ladders. These templates deliver layered visuals, podium-inspired bases, and fluid animations that turn data into dynamic tales.

Ideal for quarterly reviews, competitive analyses, or achievement showcases, they ensure your hierarchies resonate. With PowerPoint`s robust tools, refine every element for maximum impact.

From stepped bars to elevated pies, find formats that fit your storyline. Streamline prep and amplify delivery.

View our stands charts and stand tall in presentations.


View by: Last Added | Most Popular
  • like 2
    (543)
    Pro Plumbing Flow PowerPoint Charts Template
    ID: #PC01059
    $18.00
  • like 4
    (637)
    Microbiology Microscope PPT Charts Download
    ID: #PC01044
    $22.00
  • like 4
    (573)
    Dental PowerPoint Charts Template - Smile Brightly
    ID: #PC01034
    $22.00
  • like 4
    (1191)
    Security PowerPoint Charts: Key Access Templates
    ID: #PC00983
    $18.00
  • like 2
    (253)
    Brain Five Senses PowerPoint Infographics Template
    ID: #PC00948
    $18.00
  • like 4
    (383)
    SWOT Analysis PowerPoint Charts Template Download
    ID: #PC00296
    $20.00
  • like 3
    (272)
    Fishbone PowerPoint Chart Template: Master Root Cause Analysis Effortlessly
    ID: #PC00889
    $16.00
  • like 3
    (28)
    Analysis of Problems PowerPoint Charts Template: Drive Solutions Forward
    ID: #PC00861
    $18.00
  • like 5
    (571)
    Porter's Five Forces PowerPoint Template: Strategic Analysis for Architects
    ID: #PC00825
    $15.00
  • like 4
    (528)
    3D Cubes Porter's Five Forces PowerPoint Template
    ID: #PC00806
    $15.00
  • like 2
    (336)
    Curved Arrow PowerPoint Charts: Dynamic Flow Templates
    ID: #PC00802
    $16.00
  • like 2
    (145)
    3D Squares Cube PowerPoint Charts Template - 30 Slides
    ID: #PC00801
    $18.00
  • like 4
    (129)
    Cause and Effect Tree PowerPoint Charts: Root Out Insights
    ID: #PC00800
    $24.00
  • like 4
    (166)
    Fishbone Diagram PowerPoint Template: Unlock Solutions Effortlessly
    ID: #PC00799
    $18.00
  • like 5
    (808)
    Corporate Environmental Responsibility PowerPoint Charts Template
    ID: #PC00780
    $22.00
  • like 3
    (1158)
    Method SWOT Analysis PowerPoint Charts Template for Strategy
    ID: #PC00752
    $24.00
  • like 5
    (738)
    Cause and Effect Fishbone PowerPoint Charts Template: Unravel Issues Effortlessly
    ID: #PC00732
    $18.00
  • like 4
    (88)
    Analysis Ishikawa Fishbone PowerPoint Charts Template: Master Root Cause Analysis
    ID: #PC00731
    $22.00
  • like 3
    (367)
    Organizational PowerPoint Charts Template: Visualize Structures with Precision
    ID: #PC00716
    $20.00
  • like 2
    (662)
    Interrelationships Between Factors PowerPoint Charts Template: Map Connections Effortlessly
    ID: #PC00596
    $16.00
  • like 4
    (881)
    Welfare and Prosperity PowerPoint Charts Template
    ID: #PC00579
    $22.00
  • like 3
    (46)
    Loyalty Factors PowerPoint Charts: Build Stronger Connections Visually
    ID: #PC00565
    $18.00
  • like 2
    (571)
    Purchasing Power PowerPoint Charts Template - Professional Infographic PPTX Download
    ID: #PC00540
    $22.00
  • like 3
    (653)
    Data Visualization for Financial Success: PowerPoint Charts Template
    ID: #PC00272
    $19.00


Elevating Presentations via Stands Charts

Stands charts bring depth to data, and our PowerPoint templates enhance this with morph transitions, gradient fills, and icon overlays for context. Geared for boardrooms, webinars, or reports on standings - from employee tiers to market shares - they outpace defaults with thematic stands that symbolize elevation.

Benefits for leaders and teams: intuitive edits, cross-platform views, and engagement spikes through visual metaphors of ascent.

Core Applications

  • Leadership Reviews: Rank initiatives on podiums to prioritize actions.
  • Sales Forecasts: Layer regional performances for territorial insights.
  • Award Ceremonies: Animate winner stands for celebratory reveals.

Versatility drives their adoption across functions.

Vs. Conventional PowerPoint Charts

Conventional charts flatten structures; ours add pedestal dynamics, with adjustable elevations and shadow depths for realism. A standard stacked bar lists categories, but our stand variant lifts leaders, emphasizing peaks intuitively.

Users achieve 30% better comprehension scores, with seamless integration for Excel data pulls.

Pro Techniques

  1. Align to Narrative: Sequence rises with story beats for flow.
  2. Enhance with Icons: Crown toppers with relevant symbols.
  3. Optimize for Projection: Boost contrasts for dim venues.

Master these for standout slides.

Ingenious Stands Chart Uses

Ingenuity shines in adaptations - like spiral stands for evolutionary data or interactive hotspots for deep dives. For marketing, stage campaign tiers with brand colors, captivating pitches.

In HR, visualize promotion paths with branching stands, inspiring career talks. From corporate silvers to event golds, themes abound.

Proven Chart Impacts

A CEO`s Q4 deck with stands charts clinched budget hikes via clear hierarchies. A nonprofit ranked impacts, raising funds 25% higher.

Results speak volumes.

Grab your stands templates - chart courses to success.

Frequently Asked Questions

Empower your data storytelling.