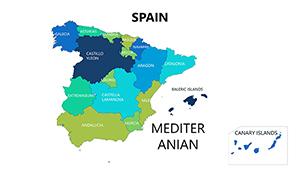
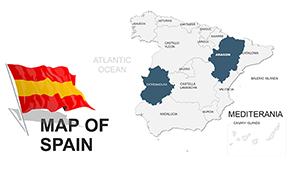
Immerse your audience in the vibrant landscapes of Spain with our curated collection of PowerPoint map templates. Designed specifically for presentations that demand clarity and impact, these templates feature editable outlines of Spain`s diverse regions, from the bustling streets of Madrid to the sun-kissed coasts of Andalusia.
Whether you`re crafting a business report on market expansion across Iberian territories, planning an educational lesson on European history, or visualizing a dream vacation route, our Spain-focused maps provide the perfect foundation. Each template is built with high-resolution vectors, ensuring scalability without loss of detail, and full compatibility with Microsoft PowerPoint for seamless customization.
Targeted at professionals, educators, and travel enthusiasts, these resources save hours of manual design work while delivering polished results. Highlight key provinces like Catalonia or Basque Country with color-coded fills, add data labels for population stats, or overlay icons for tourism hotspots - all with simple drag-and-drop ease.
Explore our selection today and transform static slides into dynamic storytelling tools. With instant downloads and unlimited edits, you`re just one click away from maps that map out success.
In a world where visual storytelling reigns supreme, incorporating accurate and aesthetically pleasing maps into your PowerPoint decks can make all the difference. Our Spain map templates stand out by offering unparalleled flexibility and precision, tailored to the unique contours of this Mediterranean gem. Unlike generic clipart or pixelated images that blur under zoom, these vector-based designs maintain crisp lines whether you`re projecting on a massive screen or sharing via email.
Imagine pinpointing economic hubs like Barcelona`s tech scene or Valencia`s agricultural prowess with effortless annotations. Professionals in real estate, logistics, and marketing use these templates to overlay sales data, route optimizations, or competitor territories, turning complex information into intuitive visuals. The result? Engaged audiences who grasp concepts faster and remember your message longer.
These elements ensure your presentations not only inform but also inspire, fostering a deeper connection with your viewers.
Spain`s map is more than lines on a page - it`s a canvas for narratives across industries. For business leaders, these templates illuminate expansion strategies: shade Andalusia in green for untapped markets or trace supply chains from Galicia`s ports to Aragon`s heartland. In one recent client project, a logistics firm used our detailed provincial outlines to simulate delivery routes, slashing presentation prep time by 40% and securing a major contract.
Educators find them invaluable for interactive lessons. Teach the Reconquista by animating historical borders or explore modern demographics with heat maps of urban vs. rural populations. Travel agents craft bespoke itineraries, layering routes from Bilbao`s Guggenheim to Seville`s Alcázar, complete with milestone markers for day trips.
Even in creative fields, like event planning or journalism, these maps add flair. A festival organizer mapped attendee flows across the Canary Islands, while reporters visualized election results with province-by-province breakdowns. Each application underscores how our templates adapt to your story, enhancing credibility and engagement.
In corporate settings, precision mapping drives decisions. Use our templates to dissect Spain`s autonomous communities - highlighting Catalonia`s innovation corridors or Extremadura`s renewable energy zones. Integrate with Excel data pulls for real-time updates, making your quarterly reviews dynamic and data-rich.
Compared to standard PowerPoint shapes, which require tedious manual adjustments, our pre-built assets offer time savings and professional polish. No more wrestling with alignment issues; focus instead on the insights that propel your team forward.
For classrooms and NGOs, our maps foster understanding. Illustrate climate impacts on the Pyrenees or migration patterns from the Strait of Gibraltar. Students engage more when geography feels alive, not abstract - add pop-up facts or quiz elements for interactive flair.
Non-profits leverage them for grant proposals: visualize aid distribution in Murcia`s drought-prone areas or conservation efforts in the Sierra Nevada. The editable nature means tailoring to specific campaigns, amplifying your mission`s reach.
To maximize impact, start with a clean canvas: import the template and duplicate layers for versioning. Employ consistent color coding - say, blues for coastal regions, earth tones for interiors - to guide the eye subconsciously. Layer transparency for overlapping data, like tourism overlays on infrastructure lines, creating depth without clutter.
Avoid overload: limit annotations to 5-7 key points per slide, using bold fonts for labels like "Madrid: 6.7M Population." Test animations sparingly - fade-ins for province reveals build suspense without distracting. For accessibility, ensure high contrast and alt text like "Interactive map of Spain`s 17 autonomous communities."
Pro tip: Pair maps with timelines or charts for holistic views. A sales deck might sequence regional growth from 2010-2025, syncing map evolutions with bar graphs. This narrative flow keeps viewers hooked, transforming data dumps into compelling journeys.
Elevate ordinary slides with thematic integrations. For a foodie presentation, iconize provinces with paella pans for Valencia or jamón for Extremadura. Travel pitches could embed 360-degree previews via hyperlinks, turning static maps into portals.
In storytelling workshops, use negative space: outline Spain and "carve" stories within regions, like a winding path through La Rioja`s vineyards for wine tours. These touches infuse personality, making your deck memorable and shareable.
Our templates support such innovations effortlessly, with scalable icons and shape libraries that align with Spain`s cultural motifs - from Moorish patterns to Celtic motifs in Galicia.
Stock PowerPoint maps often fall short: they`re rigid, low-res, and lack regional specificity, forcing users to hack together approximations. Our collection counters this with native Spanish divisions - 50 provinces plus islands - pre-vectored for edits that don`t distort.
Where defaults demand external software like Illustrator, ours stay within PowerPoint`s ecosystem, preserving workflow efficiency. Quality-wise, think broadcast-ready vs. handout-level: our designs feature subtle gradients and shadows for 3D-like depth, ideal for executive pitches.
Users report 3x faster assembly times, freeing creativity for content over cosmetics. Plus, with theme compatibility across Office versions, no compatibility headaches.
Ready to map your ideas? Browse our full gallery and download your favorites - start crafting standout presentations today.
Yes, our templates work seamlessly with PowerPoint 2016 and later, including Microsoft 365. They`re optimized for both Windows and Mac, ensuring consistent performance across devices.
Absolutely. Each element is fully editable - change colors to match your brand, add labels, or integrate charts directly onto provinces for personalized insights.
Our core templates focus on provincial and regional levels, but select options zoom into major cities like Barcelona and Seville. For ultra-detailed urban maps, pair with our city-specific add-ons.
Simply select your desired template, add to cart if premium, and download the .pptx file. Open in PowerPoint, customize, and present - no additional software required.
We offer a selection of free basic templates to get you started, with premium versions unlocking advanced features like animations and high-res exports.
Yes, all templates come with a commercial license, allowing use in client work, reports, and publications without attribution.
Transform your next presentation with Spain`s geography at your fingertips. Dive into the collection now and download the perfect map to suit your vision.
Copyright © 2009-2026 ImagineLayout All rights reserved.