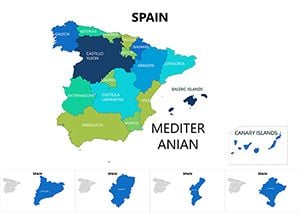
Bring your presentations to life with our professional Spain Keynote maps. Perfect for business analysis travel planning and educational projects these editable templates let you highlight regions cities and routes with ease.
Fully customizable vector maps enable smooth zooms animations and data overlays making your slides visually engaging and informative.
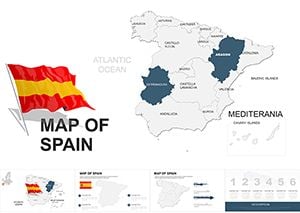
Our Spain Keynote maps go beyond standard visuals offering interactive features that allow you to illustrate data clearly and dynamically. Ideal for executives educators and travel planners these templates save time while enhancing presentation impact.
Download your template today and start mapping Spain with precision and style.
Maps range from national overviews to detailed province breakdowns, fully scalable for any presentation size.
Yes, easily drag and drop elements to annotate cities, regions, or routes.
Absolutely, ensuring crisp visuals at any zoom level.
Yes, overlay Keynote charts seamlessly on map layers for dynamic data presentations.
Base maps are current but can be edited to include historical overlays.
Copyright © 2009-2026 ImagineLayout All rights reserved.