Transform raw data into compelling stories with our school Keynote chart templates, specially designed for educators who need to illustrate statistics and trends in engaging ways. These templates leverage Keynote`s charting prowess to create pie graphs, bar charts, and line visuals that are both informative and aesthetically pleasing.
Ideal for subjects like math, economics, or research projects, they help demystify numbers for students of all ages. With drag-and-drop customization, you can input your datasets quickly and watch as animations bring growth patterns to life, fostering a deeper understanding of analytical concepts.
Our focus on educational clarity means every chart includes legends, tooltips, and scalable axes, ensuring accessibility during presentations. Whether tracking class progress or surveying opinions, these tools make data digestible and discussions more productive.
Chart your course: Check out our selection of school Keynote chart templates and integrate data-driven insights into your next lesson.


Charts are the backbone of effective data communication in education, turning abstract figures into tangible narratives. Our school Keynote chart templates excel by combining precision with visual flair, using gradients and shadows to highlight key metrics without distracting from the message. This approach contrasts with basic spreadsheets, which often overwhelm young viewers with unformatted grids.
For a science fair recap, envision a scatter plot template that clusters experiment results by hypothesis, allowing students to spot correlations intuitively through color-coded points.
Teachers find these templates invaluable for sparking analytical thinking, as interactive elements invite manipulation and `what-if` explorations.
Default Keynote charts can appear stark and uniform, lacking the contextual polish needed for classroom impact. Our templates infuse educational themes - like grid paper backgrounds for math units - enhancing relevance and retention. Moreover, they support dynamic updates, where changing data automatically resizes elements, saving revision time.
Contrast this with manual redraws in standard tools; our versions maintain proportionality and legibility across zooms, crucial for large auditorium displays.
Following these steps ensures charts serve as teaching aids rather than mere decorations, promoting data literacy from an early age.
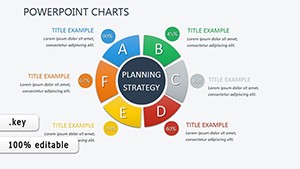
Beyond basics, these templates unlock creative avenues like gamified stats in PE classes, where progress wheels track fitness milestones. In social studies, radial charts map cultural influences, offering a circular view of interconnected histories that linear formats miss.
For administrative reporting, stacked area charts visualize resource distributions, aiding transparent decision-making with stakeholders. The flexibility encourages cross-curricular uses, blending art with analytics through custom icons.
Pro Tip: Layer multiple chart types on one slide for multifaceted views, like overlaying trends on maps for geography lessons.
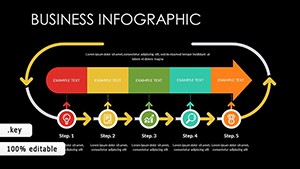
A statistics teacher in Boston employed our funnel chart templates for project pipelines, clarifying bottlenecks and lifting completion rates by 20%. An elementary coordinator used radar charts for skill assessments, providing holistic feedback that parents appreciated.
These narratives highlight how targeted charting elevates everyday teaching into insightful endeavors.
They import seamlessly from Excel, CSV, or direct entry, with auto-formatting for consistency.
Yes, with hyperlinks and build effects, students can explore data layers independently.
Indeed, select 3D options for depth in volume-based data like population densities.
Built-in validation checks data integrity, plus scalable axes prevent distortion.
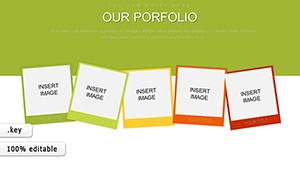
Easily - templates include photo placeholders that integrate without overlapping visuals.
Visualize success: Browse our extended chart library to refine your data storytelling skills.
Copyright © 2009-2026 ImagineLayout All rights reserved.