Sale PowerPoint Charts

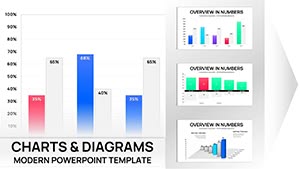
Turn numbers into narratives with Sale PowerPoint Chart Templates, where data visualization meets sales strategy in animated, insightful slides. These packs equip marketers, analysts, and executives with tools to depict revenue trends, performance metrics, and opportunity forecasts, making pitches irrefutable and reports riveting.

Native to PowerPoint, they feature drag-and-drop charts - from bars tracking quarterly surges to pies slicing market shares - enhanced by thematic animations and color schemes that align with sales funnels. Streamline your storytelling, whether closing investor rounds or motivating sales floors.

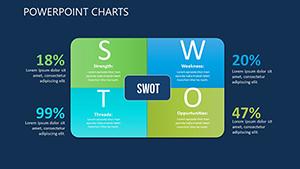
Chart your course - peruse options blending clean minimalism with bold accents. From SWOT integrations to timeline evolutions, find charts that amplify your sales acumen.


View by: Last Added | Most Popular
  • like 4
    (637)
    Microbiology Microscope PPT Charts Download
    ID: #PC01044
    $22.00
  • like 2
    (1124)
    Nanoscience and Nanotechnology PowerPoint Charts: Magnifying the Minuscule
    ID: #PC01039
    $20.00
  • like 4
    (1183)
    Music PowerPoint Charts Template - Harmonize Ideas
    ID: #PC01035
    $18.00
  • like 3
    (46)
    Devices PowerPoint Chart Template: Transform Tech Data into Engaging Visuals
    ID: #PC00888
    $18.00
  • like 3
    (517)
    Visualize Healthier Lifestyle Infographic PowerPoint Charts
    ID: #PC00880
    $15.00
  • like 3
    (956)
    Action PowerPoint Charts Template with Centralized Arrows
    ID: #PC00755
    $16.00
  • like 2
    (196)
    Master Economic Analysis with Professional PowerPoint Charts
    ID: #PC00669
    $24.00
  • like 5
    (1056)
    Complete Analysis PowerPoint Charts - Professional Presentation Template
    ID: #PC00662
    $18.00
  • like 4
    (906)
    Free Bucket Creative PowerPoint Charts Template
    ID: #PC00634
    free
  • like 3
    (309)
    Free Creative PowerPoint Chart Presentation Template for Matrices
    ID: #PC00622
    free
  • like 2
    (63)
    Arrows Badges PowerPoint Charts Template - Download PPTX
    ID: #PC00620
    $10.00
  • like 5
    (518)
    Training Courses PowerPoint Charts Template: Inspire Learning with Visuals
    ID: #PC00594
    $15.00
  • like 3
    (155)
    Analysis and Planning PowerPoint Charts: Download PPTX
    ID: #PC00593
    $18.00
  • like 3
    (707)
    Analysis Circle PowerPoint Charts Template: Decode Data Dynamics
    ID: #PC00090
    $15.00
  • like 3
    (747)
    Corporate Strategy PowerPoint Charts Template - Professional Download
    ID: #PC00496
    $22.00
  • like 3
    (677)
    Marketing PowerPoint Charts Template - Download Now
    ID: #PC00462
    $12.00
  • like 3
    (875)
    Ideological Sources PowerPoint Charts Templates
    ID: #PC00357
    $14.00
  • like 4
    (1070)
    Strategy with SWOT Analysis Marketing PowerPoint Charts Template
    ID: #PC00346
    $19.00
  • like 2
    (1088)
    Target Audience PowerPoint Charts Template: Connect Precisely
    ID: #PC00274
    $20.00
  • like 4
    (166)
    Overlapping Strategy Development PowerPoint Charts: Transform Your Decision-Making Process
    ID: #PC00259
    $21.00
  • like 4
    (298)
    Various Types PowerPoint Charts Template
    ID: #PC00253
    $24.00
  • like 4
    (845)
    Research Methodology PowerPoint Charts Template: Clarity in Every Analysis
    ID: #PC00250
    $18.00
  • like 2
    (699)
    Arrows Puzzle Time PowerPoint Charts: Unlock Dynamic Timeline Visuals
    ID: #PC00214
    $20.00
  • like 2
    (589)
    Trefoil Objects PowerPoint Charts Template: Unique Data Shapes for Impact
    ID: #PC00112
    $20.00


Transforming Data into Sales Power with Chart Templates

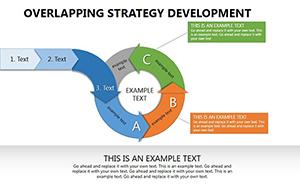
Sale PowerPoint Chart Templates demystify metrics, rendering sales pipelines as vivid voyages through interconnected visuals. Animated transitions reveal insights progressively, like funnel drops exposing bottlenecks, while layered designs allow drilling down without clutter. This method not only clarifies trends but captivates, turning data dumps into decision drivers.

Sales directors leverage them for territory overviews, mapping rep performances via heat maps. Consultants illustrate ROI models with stacked areas, quantifying client gains. Trainers dissect technique impacts through before-after comparisons, fostering skill adoption.

Strategic Edges Provided

  • Insight Acceleration: Pre-animated flows save scripting hours.
  • Persuasion Power: Visual metaphors make abstracts actionable.
  • Customization Depth: Excel linkages update live during edits.
  • Accessibility: Alt tags and contrasts meet inclusivity standards.

Superiority Over Standard Chart Creations

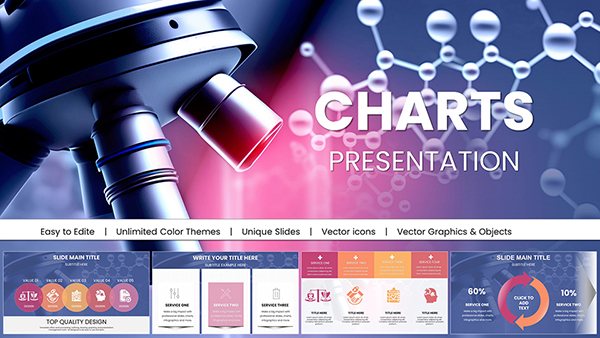
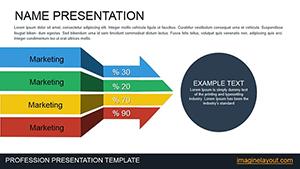
Standard PowerPoint charts default to drab defaults, demanding manual overhauls for appeal. Our Sale Templates arrive polished, with sales-specific motifs like upward arrows for conversions and radial gauges for targets, obviating aesthetic angst. They embed best-fit types - scatter for correlations, lines for trajectories - tailored to sales cycles, unlike generic selectors.

Contrast a vanilla bar graph with one overlaid on revenue waves; the latter contextualizes spikes narratively. Smart guides and theme locks prevent drift, ensuring cohesion across decks.

Premium Perks

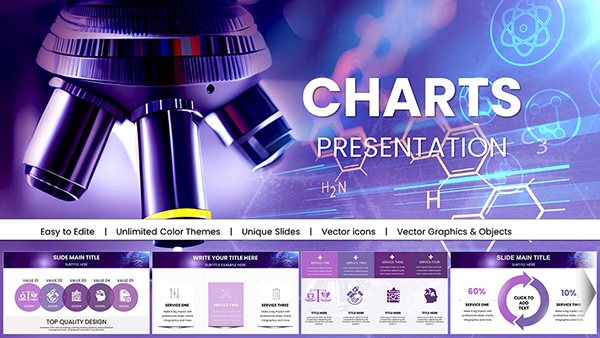
Bonus icon sets and legend automations streamline builds, while variant packs offer dark/light modes for versatility. Data validation prompts catch errors pre-presentation, a safeguard stock tools overlook.

Targeted Applications in Sales Scenarios

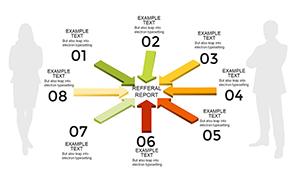
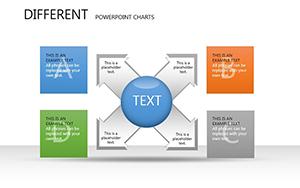
Pipeline reviews pop with radial progress wheels, spotlighting deal stages for team huddles. Competitor analyses employ Venn overlaps, clarifying differentiators in boardrooms. Forecast decks utilize Monte Carlo simulations via scatter clouds, hedging uncertainties visually.

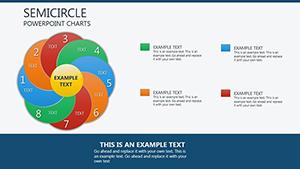
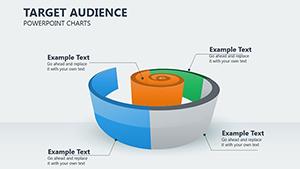
Customer segmentation slices demographics into donut breakdowns, informing targeted outreaches. These uses affirm the templates` role in sales symphonies, harmonizing data with dialogue.

Mastery Tips

  1. Type alignment: Match charts to stories - lines for evolutions, pies for wholes.
  2. Color coding: Assign hues to categories for instant recognition.
  3. Animation pacing: Sync reveals to speaking rhythms for emphasis.
  4. Source citing: Footer links bolster credibility transparently.

These habits hone charts into compelling companions, elevating every slide.

Inventive Integrations for Chart Creativity

Fuse timelines with bubble overlays for multi-metric tales, like launch impacts on engagement. Gamify quotas with progress radars, rallying reps interactively. Sustainability reports layer carbon footprints atop sales curves, advocating green growth.

Personalized dashboards embed user data pulls, tailoring views dynamically. Such sparks ignite template transcendence, from fintech forecasts to nonprofit fundraisers.

Plot your prosperity - examine Sale PowerPoint Chart Templates and download to depict triumphs vividly.

Frequently Asked Questions

What chart types are included?

Bars, lines, pies, scatters, and more, optimized for sales contexts.

Do animations work in all PowerPoint versions?

Compatible from 2016 onward, with fallback statics for older.

Can data update automatically?

Yes, via Excel embeds for real-time refreshes.

Are they suitable for large datasets?

Scalable vectors handle volumes without quality loss.

How do I add custom labels?

Edit via chart tools or text overlays for precision.

Graph your gains - acquire Sale PowerPoint Chart Templates now and illuminate your sales story.