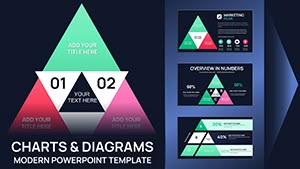
Add movement and visual impact to your data with ripple style PowerPoint chart templates designed to capture attention instantly. Inspired by circular waves and expanding patterns, these layouts transform ordinary numbers into engaging visual stories that feel modern and dynamic.
Whether you are preparing a quarterly business report, marketing analytics presentation, startup pitch, or educational lecture, ripple charts help highlight growth, influence, and layered data relationships. Each slide is fully editable, allowing you to adjust colors, text, percentages, and shapes in seconds. No design skills required. Simply insert your data and present with confidence.
If you want charts that look more professional than default PowerPoint graphics and instantly elevate your slides, ripple themed templates are a powerful visual solution.
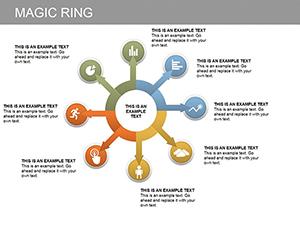
Ripple inspired charts are perfect when you want to visualize expansion, impact, influence, or cause and effect relationships. The circular flow naturally guides the audience eye from the center outward or from outer layers inward, making complex information easier to follow.
Unlike basic bar or pie charts, ripple layouts add depth and hierarchy. They are ideal for illustrating:
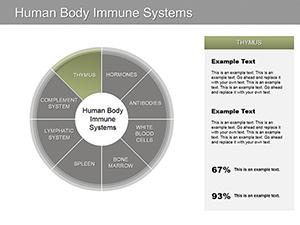
Executives and managers often need to show performance growth, regional expansion, or department impact. Ripple charts visually communicate progress from a central goal outward to measurable results. This makes annual reports and investor presentations more persuasive and easier to understand.
Marketing teams can use ripple diagrams to present campaign reach, audience layers, conversion funnels, and brand awareness growth. The circular expansion effect perfectly supports storytelling about increasing engagement and market penetration.
Teachers and trainers benefit from ripple charts when explaining cause and effect, concept mapping, or layered processes. The visual flow keeps learners focused and improves retention compared to plain bullet slides.
Founders can showcase product ecosystems, roadmap phases, and scaling strategy using ripple layouts. Investors appreciate clean, structured visuals that simplify complex business models.
Standard charts are functional but often look generic and overused. Ripple templates offer:
Instead of manually adjusting shapes and aligning elements, you start with a polished layout that only needs your content. This reduces preparation time and improves presentation quality instantly.
Place your main objective or key metric in the center of the ripple. Every surrounding layer should logically connect to that core idea.
Apply subtle color shifts from inner to outer layers to visually emphasize progression or expansion.
Keep each ring concise. Short phrases or numbers work best to maintain clarity.
Reveal ripple layers step by step during your presentation to guide attention and build a compelling narrative.
Upgrade your next presentation with ripple style PowerPoint chart templates that combine structure and creativity. Choose a layout that matches your topic, customize it in minutes, and deliver a presentation that stands out. Download your professional template today and turn data into visual impact.
Yes all shapes colors text elements and data values can be customized directly in PowerPoint without additional software.
Absolutely ripple charts are ideal for annual reports marketing analysis strategy presentations and executive summaries.
Templates are compatible with modern PowerPoint versions and can be easily adapted to your preferred slide size.
Yes they are especially effective for showing growth audience reach campaign impact and layered customer segments.
Copyright © 2009-2026 ImagineLayout All rights reserved.