Illuminate your accomplishments with our results PowerPoint templates, engineered to distill data into digestible, persuasive stories. Aimed at analysts, executives, and consultants, these layouts prioritize metrics that matter, from sales surges to project wins.
Integrate pie charts, bar graphs, and infographic summaries that pop against neutral backdrops, ensuring instant grasp. Tailored for performance reviews, investor updates, or team debriefs, they blend rigor with readability to underscore progress.
Gain an edge over generic spreadsheets by visualizing trends with animated reveals and comparative overlays. Edit metrics on the fly for tailored narratives, empowering confident deliveries. For those measuring what counts, this collection delivers clarity and conviction. Scan through and spotlight your triumphs.
Decision Making PowerPoint Template: Chart Your Path to Choices
ID: #PP03652
$10.00
(1147)
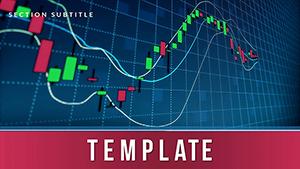
Analytics and Forecasting PowerPoint template
ID: #PP03335
$12.00
(548)
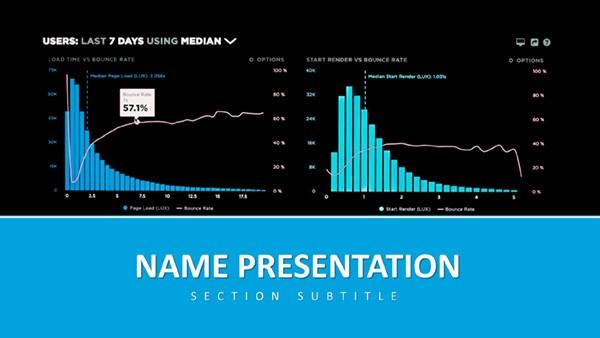
Google Analytics PowerPoint template
ID: #PP02869
$12.00
(820)
Finding Solutions To Issues PowerPoint template
ID: #PP02539
$12.00
(528)
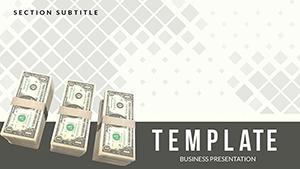
Accumulation System of Money PowerPoint templates
ID: #PP02427
$12.00
(1014)
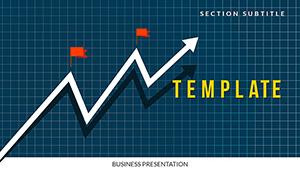
Experts Predicted an Increase in Investment PowerPoint templates
ID: #PP02414
$12.00
(29)
Search PowerPoint Templates - Presentation
ID: #PP02343
$12.00
(1125)
Rational use of computer PowerPoint template
ID: #PP02280
$12.00
(1004)
Ways to Increase Revenue PowerPoint templates
ID: #PP02248
$12.00
(630)
Promote Your Website with our SEO PowerPoint Template: Presentation
ID: #PP02171
$12.00
(369)
SEO Marketing PowerPoint templates
ID: #PP02170
$12.00
(404)
Seo Services PowerPoint Template for Presentation
ID: #PP02169
$12.00
(660)
How to Earn Money PowerPoint templates
ID: #PP02154
$12.00
(448)
MONEY: Personal Finance PowerPoint templates
ID: #PP02151
$12.00
(781)
Investment Money Market PowerPoint Template
ID: #PP02136
$12.00
(794)
Make Money from Online Business PowerPoint Template: Monetize Your Message
ID: #PP01960
$12.00
(758)
Financial Success: Learn, Collect Money, and Save with PowerPoint Presentation Template
ID: #PP01928
$12.00
(50)
SEO Strategy PowerPoint template, Background Presentation
ID: #PP01892
$12.00
(561)
Website promotion PowerPoint template
ID: #PP01885
$12.00
(272)
SEO PowerPoint templates
ID: #PP01841
$12.00
(632)
Money Income PowerPoint templates
ID: #PP01806
$12.00
(70)
SEO Promotion PowerPoint template
ID: #PP01572
$12.00
(428)
Abstract Peak PowerPoint Template: Summit of Visual Excellence
ID: #PP00684
$5.00
Harnessing Data for Storytelling Excellence
Results demand celebration, but raw numbers bore. Our templates reframe them as narratives - progress bars filling to denote targets met, eclipsing static tables in standard suites with contextual annotations and trend lines.
Marketers tally campaign ROIs; researchers quantify study impacts. The value? Scalable visuals that adapt to datasets large or small, maintaining elegance.
Survey Analyses: Word clouds amplifying qualitative insights.
Mastering Results Presentation Dynamics
Frame with a headline slide touting top-line wins, then drill down via layered charts. Employ color gradients for positive trajectories, and include variance explanations to preempt questions.
PowerPoint`s chart tools shine here - link to sources for credibility, and use sparklines for compact histories.
Pro Refinement Methods
Filter data views for audience relevance.
Add icons scaling with values for intuitive scale.
Conclude with forward-looking projections.
These ensure audiences absorb and act on insights.
Proven Outcomes from Users
A consulting firm clinched renewals with our metric-heavy decks, noting 20% higher retention. Nonprofits amplified grants via impact visuals, securing 50% more funding. Testimonials validate their persuasive prowess.
Frequently Asked Questions
Quantify your wins vividly - choose a template and present with purpose. Uncover further PowerPoint gems in other sections.