Layer your data with sophistication using our pyramid chart templates for Keynote, ideal for analysts, educators, and executives seeking to convey hierarchies and progressions. These charts stack information intuitively, from broad bases to focused summits, making abstract concepts tangible.
With gradient fills, precise proportions, and editable data inputs, they adapt to any narrative - be it process flows or priority matrices. Keynote`s fluid animations bring them to life, revealing segments with poise.
Our assortment covers inverted, stepped, and radial pyramids for varied perspectives. Step into this category to chart courses that captivate and clarify. Elevate your data display now.
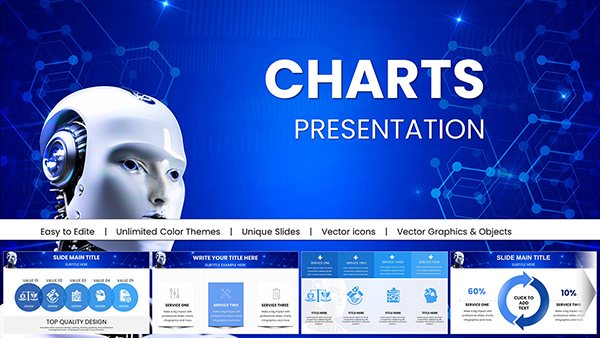
AI Keynote Presentation Templates with Robot AI Charts
ID: #KC01020
$20.00
(863)
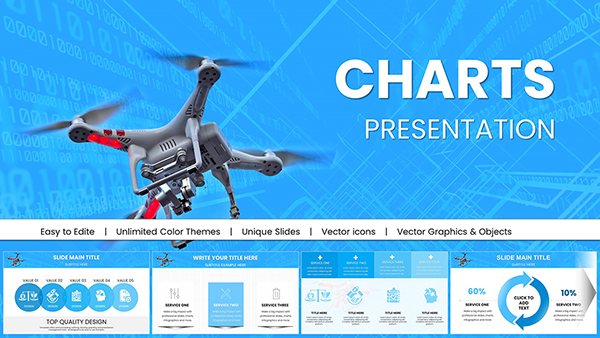
Drone Commercial Keynote Charts for Presentation
ID: #KC00998
$20.00
(767)
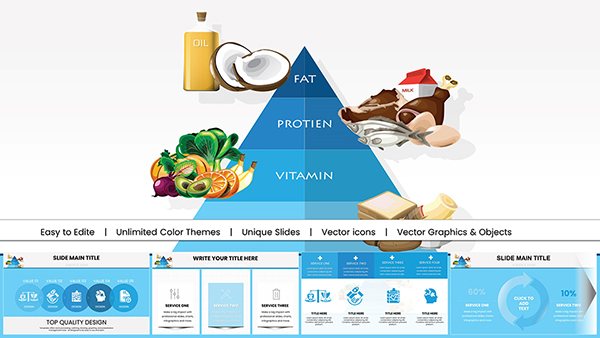
Food Pyramid Keynote Charts Presentation
ID: #KC00989
$18.00
(1066)
Construction Companies Keynote Charts Template: Build Visions with Data-Driven Clarity
ID: #KC00984
$20.00
(66)
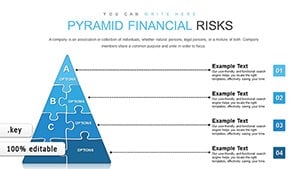
Pyramid Financial Risks Charts: Master Risk Visualization in Keynote
ID: #KC00857
$16.00
(678)
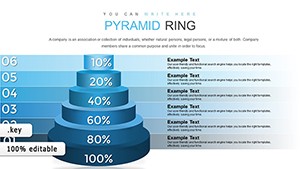
Pyramid Ring Keynote Charts: Master Farm Activity Analysis
ID: #KC00847
$18.00
(158)
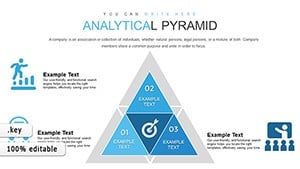
Analytical Pyramid Keynote Charts: Elevate Your Architectural Presentations
ID: #KC00845
$22.00
(916)
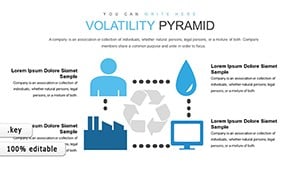
Volatility Pyramid Keynote Template: Master Business Uncertainties
ID: #KC00842
$10.00
(140)
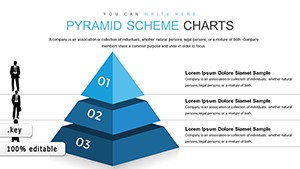
Pyramid Scheme Keynote Charts
ID: #KC00816
$18.00
(747)
3D Horizontal Split Pyramid Keynote Charts: Dynamic Data Visualization
ID: #KC00748
$15.00
(252)
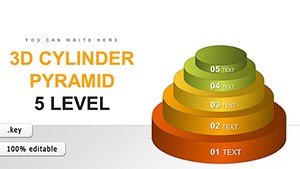
5-Level 3D Cylinder Pyramid Keynote - Fully Editable | ImagineLayout
ID: #KC00746
$17.00
(399)
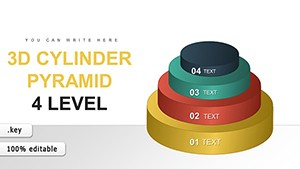
4-Level 3D Cylinder Pyramid Keynote - Fully Editable | ImagineLayout
ID: #KC00745
$17.00
(980)
3D Pyramid Keynote Charts - Fully Editable | ImagineLayout
ID: #KC00744
$20.00
(1100)
5-Level 3D Pyramid Template - Editable | ImagineLayout
ID: #KC00743
$22.00
(306)
4-Level 3D Pyramid Charts - Editable | ImagineLayout
ID: #KC00742
$21.00
(19)
8-Level 3D Pyramid Keynote Charts - Editable KEY | ImagineLayout
ID: #KC00730
$22.00
(990)
7-Level 3D Pyramid Keynote Charts - Editable KEY | ImagineLayout
ID: #KC00729
$22.00
(443)
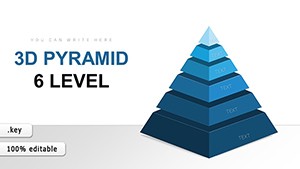
6-Level 3D Pyramid Keynote Charts - Editable KEY | ImagineLayout
ID: #KC00728
$20.00
Harnessing Pyramid Charts for Keynote Excellence
Pyramid charts excel at depicting accumulations or deconstructions, and our Keynote templates refine this into artful precision. They dissect workflows or build consensus visuals, engaging viewers in strategy alignments or lesson deliveries.
Product managers chart feature stacks, while trainers layer skill developments. The essence? Transformed comprehension and inspired actions.
Strategic Applications Across Fields
Process Optimization: Base inputs to output peaks, identifying efficiencies.
Priority Setting: Weight tasks by impact, guiding resource allocation.
Population Studies: Demographic tiers from youth to elders.
Sales Pipelines: Stages from leads to closes, with conversion metrics.
Surpassing scatter plots, pyramids impose natural order, with auto-scaling for data shifts.
Charting Mastery Techniques
Balance visuals: Equal segment heights for equity, or tapered for emphasis. Employ build orders for narrative flow, and legends for context. A gem - hybridize with bubbles for quantitative pops within layers.
Impact example: A nonprofit layered impact metrics, rallying donors with visual progression.
Set to summit your charts? Survey selections and scale up.
Signature Traits for Superior Charts
Distinctions include mathematical accuracy for proportional stacks and theme-syncing colors. They`re gesture-friendly for iPad edits, expanding mobile creation.
These traits amplify portability, from rehearsals to remote shares.
Dynamic Examples to Emulate
Risk Assessment: Low to high threats, with mitigation notes per level.
Budget Breakdowns: Categories from fixed to discretionary spends.
Learning Curves: Beginner basics to expert nuances.
Supply Chains: Raw materials to end-user deliveries.
Such illustrations affirm the templates` analytical agility.
Frequently Asked Questions
Resolving pyramid chart quandaries.
How to input data into pyramid segments?
Edit the data table; charts regenerate proportions automatically.
Support for inverted pyramids?
Included, flipping top-down for deconstructions like decision trees.
Can charts be exported to other formats?
Yes, to PDF, images, or PowerPoint for cross-platform use.
Animation options for reveals?
Magic Move and dissolve builds create layered unveilings.