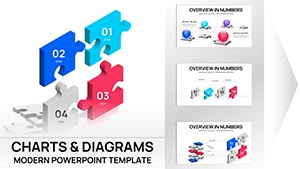
Bring your ideas to life with our collection of puzzle diagram PowerPoint templates. Each template features interlocking pieces that help visualize complex concepts in a clear and engaging way.
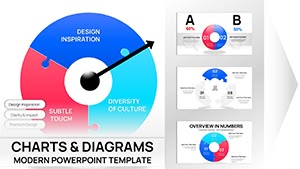
Ideal for professionals, educators, and trainers, these templates simplify strategy explanations, highlight teamwork, and showcase problem-solving efficiently. Fully editable layouts and vibrant colors make customization effortless.
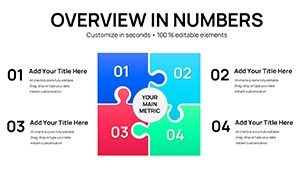
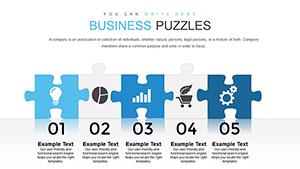
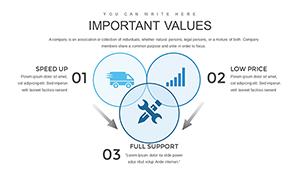
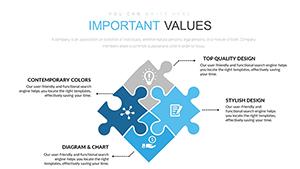
Puzzle diagrams turn abstract ideas into clear visuals that audiences immediately understand. Interlocking pieces symbolize collaboration, integration, and completion, making them ideal for explaining complex processes.
Common Use Cases
Business strategy sessions illustrating departmental alignment
Team-building workshops showing roles and contributions
Project management overviews mapping phases and dependencies
Educational lessons on systems, processes, or problem-solving
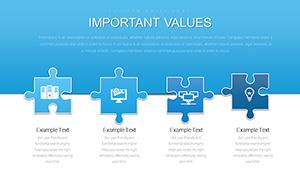
Unlike standard shapes, our puzzle templates are pre-built with precise connections, layered effects, and animations. They include multiple piece counts and color options to match your brand.
Best Practices
Use concise text per piece for readability
Apply progressive animations to build the puzzle step-by-step
Highlight the completed puzzle to reinforce unity
Combine icons with text for visual impact
Select contrasting colors to guide attention
Creative Applications
Use puzzle diagrams for sales funnels, customer journeys, HR skill alignment, innovation roadmaps, and personal development plans. Engage your audience with visually compelling slides.
Ready to enhance your presentation? Browse and download your favorite puzzle templates now.
Frequently Asked Questions
What makes puzzle diagrams effective in presentations?
They visually demonstrate connections and completeness, helping audiences grasp how separate elements form a unified whole.
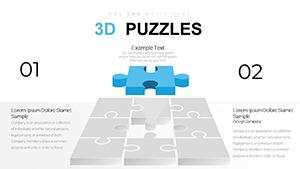
Can I animate puzzle pieces individually?
Yes - most templates include built-in animations for entrance effects, allowing pieces to appear one by one or snap together.
Are these templates compatible with Google Slides?
Many designs export seamlessly, though full animation support works best in PowerPoint.
How many puzzle pieces should I use?
Use 4-6 pieces for simple overviews or 9-12 for detailed presentations.
Can I add images to puzzle pieces?
Yes - overlay photos or replace backgrounds for personalized slides.