Product PowerPoint Charts
Turn product metrics into compelling visuals with our Product Chart PowerPoint Templates , built for teams who need to communicate data clearly and confidently. Whether you`re sharing user growth, A/B test results, or feature performance, these slides give you the tools to present with impact. With editable charts, modern design systems, and smart layouts, you`ll quickly craft presentations that resonate with stakeholders, developers, and customers alike.
From product demos to quarterly planning meetings, these templates help you tell a data-driven story. Enjoy a range of chart types - pie, bar, line, area, and more - all ready to customize for your next big pitch or report.
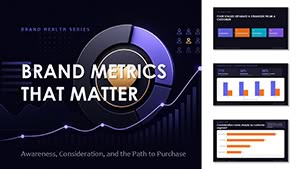
Brand Metrics That Matter PowerPoint Template with Editable Charts
ID: #PC01162
Political Party and Leader Ratings PowerPoint Template with Editable Charts
ID: #PC01160
Sales Funnel PowerPoint Template with Editable Charts
ID: #PC01157
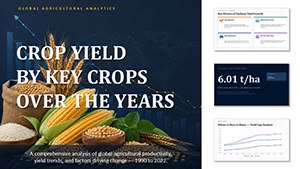
Crop Yield by Key Crops Over the Years PowerPoint Template and Charts
ID: #PC01150
Hotel Occupancy by Region PowerPoint Template and Charts
ID: #PC01148
Sales Forecast PowerPoint Template and Charts
ID: #PC01143
Profit Margin by Product Chart Template for PowerPoint
ID: #PC01135
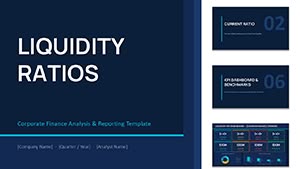
Liquidity Ratios PowerPoint Template - Editable PPTX | ImagineLayout
ID: #PC01128
Corporate Capital Structure PPT - Editable PPTX
ID: #PC01127
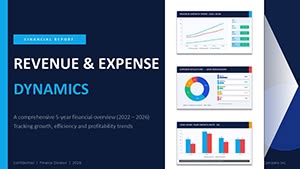
Revenue Expense Dynamics Charts - Editable PPTX | ImagineLayout
ID: #PC01116
Finish Line PowerPoint Charts - 41 Premium Slides for Project Tracking
ID: #PC01109
Circular Cycle Diagram Template for PowerPoint
ID: #PC01091
Porter's Diamond Charts PPT Template - 38 editable slides
ID: #PC01089
Ansoff Matrix Charts PPT Template for PowerPoint
ID: #PC01082
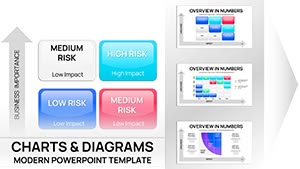
Risk Matrix Charts Template for PowerPoint
ID: #PC01080
Pro Plumbing Flow PowerPoint Charts Template
ID: #PC01059
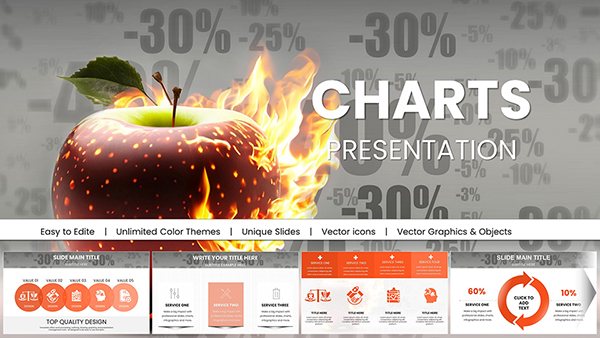
Burning Discounts PowerPoint Charts Template
ID: #PC01043
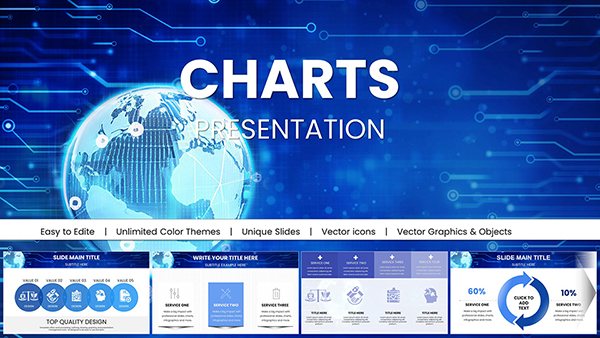
Worldwide Internet Network PowerPoint Charts for Data Mastery
ID: #PC01030
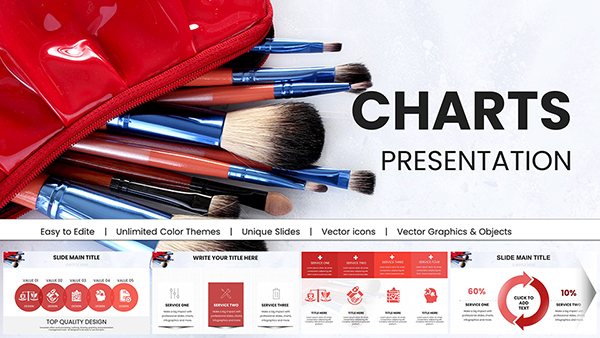
Cosmetic Brushes Accessories PowerPoint Charts: Brush Up Your Presentations
ID: #PC01003
Nail Polishes and Cosmetics PowerPoint Charts: Transform Your Beauty Presentations
ID: #PC01002
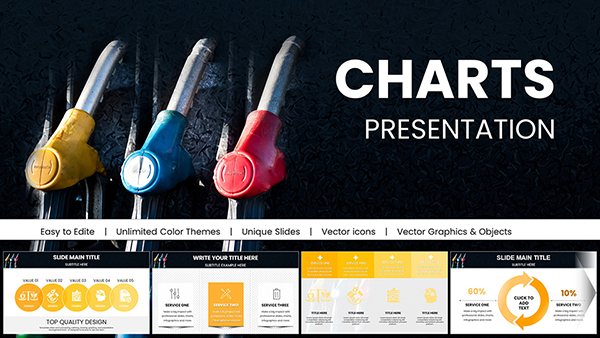
Gasoline Fuel Pump PowerPoint Charts - Download and Editable Presentation Template
ID: #PC01000
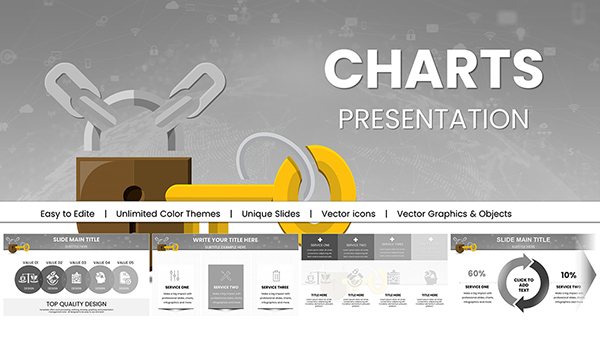
Security PowerPoint Charts: Key Access Templates
ID: #PC00983
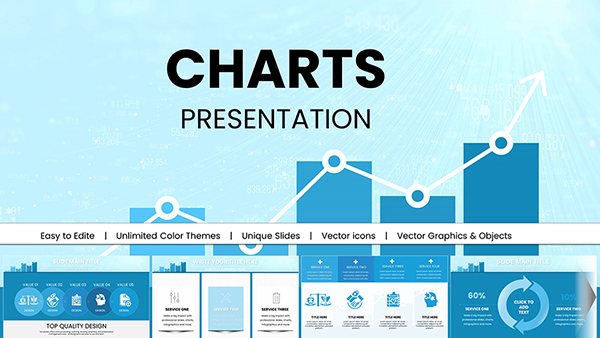
Analytical Graphics PowerPoint Charts: Master Data Visualization
ID: #PC00971
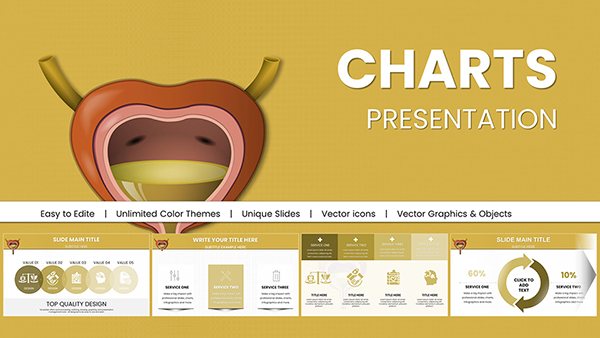
Urinary System PowerPoint Charts: Precision for Medical Insights
ID: #PC00963
Designed for Product Thinkers
Generic templates rarely capture the nuances of product data. Our collection is tailored to product teams with features like:
User funnel visualizations for engagement and retention insights.Roadmap timelines that align teams around goals.A/B comparison charts to highlight experiment outcomes.Sales and churn dashboards for investor or board updates.
How Product Teams Use These Templates
Stakeholder Updates - Share clean, data-rich slides that explain performance at a glance.Feature Prioritization - Compare impact metrics with clear visual hierarchies.Quarterly OKR Reviews - Highlight progress with trend lines and growth charts.Customer Insights - Visualize survey results and user segmentation with easy-to-read graphs.
Why These Templates Work Better Than Defaults
Off-the-shelf chart slides often lack context. Our templates are crafted to:
Tell product stories by pairing charts with strategic layouts.Reduce cognitive overload with balanced visuals and whitespace.Support cross-functional communication with clear labeling and intuitive graphics.Fit modern product aesthetics with sleek, up-to-date styles.
Tips to Make the Most of These Templates
Choose the right chart - Use line charts for trends and bar charts for categorical comparisons.Keep data updated before presenting - stale numbers undermine trust.Use consistent color meaning to avoid confusion (e.g., green = growth, red = decline).Pair charts with insight bullets to guide your audience through the story.
Pick a product chart template that matches your narrative and start building presentations that influence decisions.
Frequently Asked Questions
Are these templates suitable for cross-team reviews?
Absolutely - they’re designed to be clear and understandable for engineers, designers, and business leaders alike.
Can I customize colors to match our product brand?
Yes, all colors, icons, and text are fully editable to reflect your product’s identity.
Do these templates include animations?
Many templates include optional, subtle animations to enhance flow without distracting from data.
Is support provided if I have questions?
Yes, imagineLayout support guides you through common customization questions.