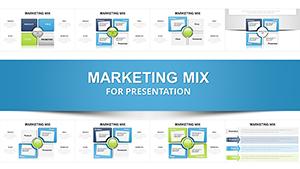
Transform your marketing narratives with specialized PowerPoint chart templates focused on processes. Ideal for analysts, campaign managers, and executives, these charts distill intricate strategies into digestible visuals, from lead nurturing sequences to performance tracking.
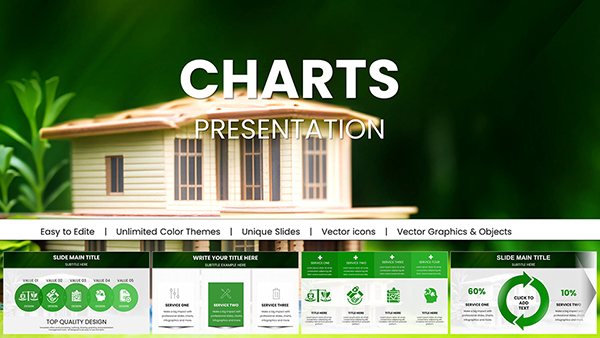
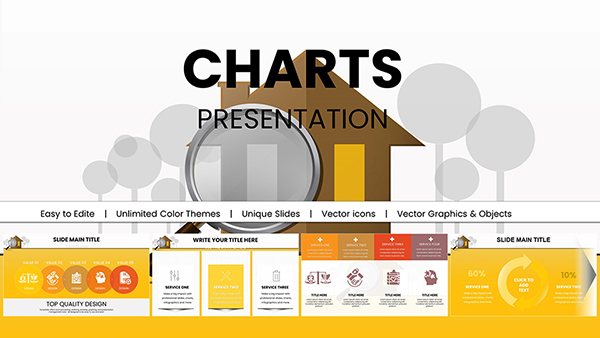
Each template boasts clean lines, scalable vectors, and integrated data tools, making it easy to input your metrics and watch insights emerge. Say goodbye to cluttered spreadsheets - hello to polished slides that command attention and facilitate strategic discussions.
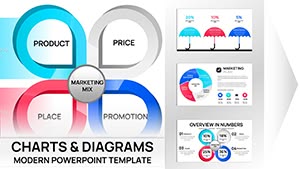
Whether mapping AIDA models or content distribution pipelines, our designs emphasize progression with color-coded segments and arrow indicators. Fully compatible with PowerPoint`s animation suite, they add motion to your message without complexity.
Browse this category to discover charts that fit your marketing rhythm. Download and deploy in minutes for presentations that drive results.
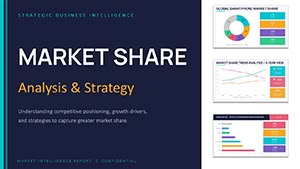


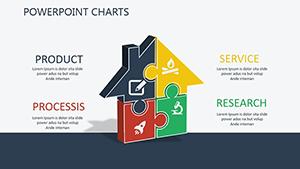


In the fast-paced world of marketing, clear visualization is key to alignment. Our PowerPoint charts for process marketing excel at breaking down silos, showing how tactics interconnect to fuel growth. They go beyond basic bar graphs by incorporating process-specific elements like milestones and decision points.
Versus off-the-shelf charts, ours offer thematic consistency - marketing hues and icons that resonate with industry audiences. This cohesion builds trust and professionalism, often leading to more persuasive pitches.
A standout example: A CMO employed our radial process chart to visualize omnichannel integration, resulting in a 30% uptick in cross-department collaboration. Innovate further by blending charts with infographics for hybrid views that tell multifaceted stories.
Empower your team with visuals that clarify and captivate. Select a template and start charting your path to success.
These templates shine in their adaptability, supporting everything from quarterly reviews to investor decks. They reduce design friction with pre-formatted axes and labels, allowing focus on analysis rather than aesthetics. Users appreciate the embedded formulas for quick calculations, a feature absent in generic tools.
Explore creative twists like gamified processes - add progress bars to motivate teams during campaign executions. For remote settings, optimize for screen sharing with high-resolution exports that retain detail.
Pair these with storytelling slides to create immersive experiences. For instance, transition from a high-level overview chart to detailed breakdowns, guiding viewers through layers of insight. This method has proven effective in workshops, fostering deeper understanding and idea generation.
Step up your marketing game - download now and witness enhanced clarity in every slide.
They include marketing-specific icons and layouts optimized for workflow visualization, far surpassing generic templates.
Yes, built-in entrance effects allow sequential reveals, perfect for step-by-step explanations.
Definitely - scalable vectors handle extensive data without quality loss, ideal for detailed reports.
PowerPoint 2016 or later; compatibility extends to Google Slides with minor adjustments.
Simply edit the linked Excel sheet or input directly into placeholders for instant updates.
Yes, cloud-compatible formats enable real-time edits in shared environments.
Copyright © 2009-2026 ImagineLayout All rights reserved.