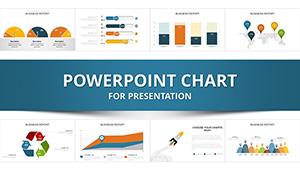
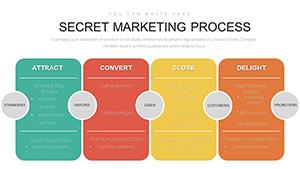
Transform abstract strategies into actionable visuals with our planning chart templates for PowerPoint. Geared toward project managers and strategists, these slides offer pre-built frameworks for Gantt charts, flow diagrams, and milestone trackers that simplify complex planning.
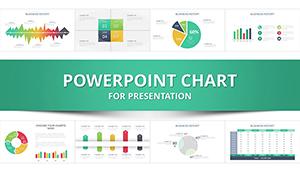
Whether coordinating team efforts or outlining quarterly goals, these templates ensure clarity and alignment. With editable elements like color-coded phases and progress bars, you can adapt them on the fly during presentations.
Aimed at professionals in dynamic environments, they reduce preparation time while enhancing comprehension. Discover how structured visuals can turn plans into performance - explore our collection now.


Effective planning hinges on visualization, and our PowerPoint chart templates deliver just that. Tailored for strategic foresight, they go beyond basic spreadsheets by embedding interactive elements like draggable milestones and conditional formatting for real-time updates. This contrasts sharply with default PowerPoint charts, which often lack thematic cohesion and scalability.
Users appreciate the time savings - craft a comprehensive plan in under an hour versus days of manual alignment - leading to more focused meetings and fewer miscommunications.
These applications make planning accessible, turning data dumps into decision-making tools.
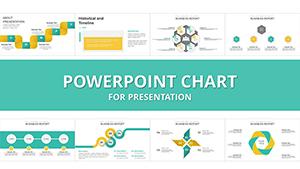
Standout features include layered animations for phased reveals and compatibility with Excel imports for dynamic data pulls. Best practices? Start with stakeholder input to define axes, then layer in risk matrices for proactive adjustments. Avoid overcrowding slides - limit to 5-7 elements per chart for digestibility.
A tech firm used our Gantt template to visualize a six-month app launch, incorporating burndown charts that adjusted live during demos, securing investor buy-in. Creatively, embed hyperlinks to detailed sub-plans or use shape morphing for smooth transitions between planning stages.
Another innovation: Hybrid charts blending PERT with Kanban boards for visual flexibility in hybrid work setups. Or, thematic skins - like blueprint aesthetics for architecture - to infuse personality without sacrificing professionalism. These tweaks not only engage but also embed your brand narrative into every slide.
Push boundaries further with VBA scripts for auto-updates from project management tools, creating living documents that evolve with your plans.
Such strategies ensure your charts don`t just plan - they propel execution forward.
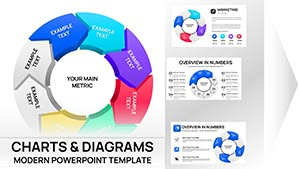
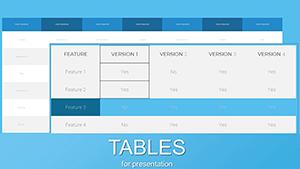
Gantt, PERT, timelines, flowcharts, and SWOT matrices, all optimized for PowerPoint`s native tools.
Copy-paste from Excel or use built-in data links for seamless synchronization.
Yes, adjust timing, triggers, and paths via PowerPoint`s animation pane for tailored reveals.
Templates are PowerPoint-native but export cleanly to Google Slides with minor adjustments.
Use drill-down hierarchies and filters to manage complexity without overwhelming slides.
Chart your course to success - grab a planning template today and bring strategies to life.
Empower your team with visuals that inspire action; download and deploy now.
Copyright © 2009-2026 ImagineLayout All rights reserved.