Unlock efficiency with our Pareto chart PowerPoint templates, essential for anyone applying the 80/20 rule to streamline decisions. These specialized designs help identify top contributors in datasets, from defect causes in manufacturing to sales drivers in retail, all within familiar PowerPoint slides.
Built for analysts, managers, and consultants, the templates feature sorted bar graphs overlaid with cumulative lines, making it simple to spotlight vital few over trivial many. Save time on manual calculations and focus on actionable strategies that boost productivity.
Whether auditing processes or optimizing resources, these charts deliver clarity at a glance. Peruse our collection and integrate Pareto principles into your next presentation effortlessly.

Pareto charts embody the Pareto Principle, revealing that 80% of outcomes stem from 20% of causes - a game-changer for prioritization. Our PowerPoint templates simplify creation, with pre-formatted axes, color-coded bars for immediacy, and embedded formulas for dynamic updates.
Standard PowerPoint charts require extensive tweaking for sorting and cumulation, often leading to errors, whereas ours automate these for accuracy and speed. Teams using them report clearer meetings and faster resolutions, transforming vague discussions into targeted plans.
For instance, a logistics firm used our template to chart delay causes, revealing route planning as the 80% culprit - leading to a 25% efficiency gain post-implementation.
Start with clean data: Sort descending by frequency, then plot cumulative percentages aiming for the 80% crossover. Use contrasting colors for bars and lines, and add labels for context without clutter. Validate with real metrics to ensure relevance.
Advanced tip: Combine with fishbone diagrams in multi-slide setups for root-cause deep dives, amplifying analytical depth in reports.
Eager to prioritize? Grab a Pareto template and chart your path to smarter decisions.
In healthcare, Pareto charts track patient wait factors, with bars for staffing vs. equipment - hospitals adjusted shifts accordingly, slashing delays. Marketing teams visualize campaign ROI, focusing budgets on high-engagement channels for amplified reach.
Environmental groups apply them to pollution sources, advocating policy changes based on dominant emitters. These stories illustrate the chart`s adaptability across sectors, fostering data-driven cultures.
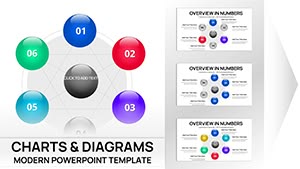
A hybrid bar graph and line chart showing causes ranked by impact, with the line tracking cumulative contribution to highlight the vital few.
Paste your categories and values into the linked Excel sheet; the chart auto-updates with sorting and calculations built-in.
Yes, subtle builds reveal bars sequentially, then the cumulative line, for engaging reveal of insights.
Optimized for up to 50 items, with tips for aggregation if needed to keep visuals clean and focused.
The sorting and cumulative line add prioritization layers, making it ideal for decision-making over simple comparisons.
Delving deeper, Pareto analysis fosters a mindset of focus amid abundance - perfect for overloaded schedules. Download now to apply this timeless tool and reclaim control over your priorities. This guide spans essential techniques to advanced tactics, arming you for success.
Copyright © 2009-2026 ImagineLayout All rights reserved.