Organization PowerPoint Charts

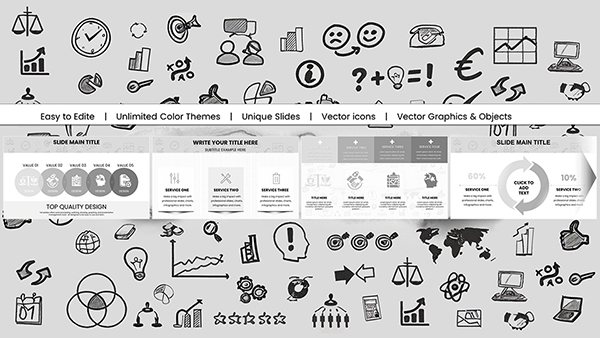
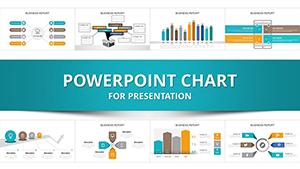
Master the art of data organization with our PowerPoint chart templates, engineered to simplify complex structures into digestible visuals. Perfect for strategists, consultants, and team leads, these tools help articulate hierarchies, workflows, and metrics with confidence.

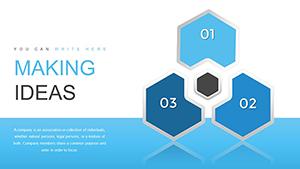
Boasting diverse formats like flowcharts and radial diagrams, they fit any narrative, from quarterly reviews to strategic planning sessions. With editable text, shapes, and colors, personalization is effortless, ensuring your brand shines through every slide.

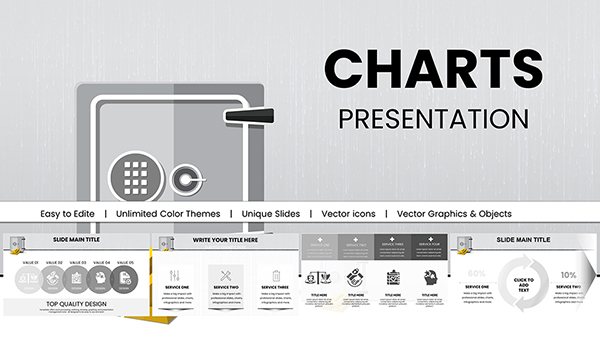
Step up your presentation game - browse our collection and download templates that make organization intuitive and engaging.


View by: Last Added | Most Popular
  • like 2
    (544)
    Professional Leadership PowerPoint Charts: Inspire and Lead with Clarity
    ID: #PC01065
    $18.00
  • like 4
    (821)
    Pro Chemical & Biochemical Education PowerPoint Charts
    ID: #PC01062
    $22.00
  • like 5
    (953)
    Engaging Online Math PowerPoint Charts Template
    ID: #PC01060
    $18.00
  • like 5
    (586)
    Sport Baseball PowerPoint Charts - Download Presentation
    ID: #PC01058
    $20.00
  • like 5
    (564)
    Psychology of Leadership PowerPoint Charts for Aspiring Leaders
    ID: #PC01051
    $24.00
  • like 4
    (177)
    Chemistry Presentations with Customizable Education PowerPoint Charts: Fuel Discovery
    ID: #PC01048
    $22.00
  • like 4
    (943)
    Online Education PPT Charts Template Download
    ID: #PC01046
    $15.00
  • like 3
    (154)
    Chemical and Biochemical Engineering PowerPoint Charts: Precision Tools for Complex Insights
    ID: #PC01041
    $18.00
  • like 5
    (621)
    Educational PowerPoint Charts: Igniting Minds with Visuals
    ID: #PC01037
    $15.00
  • like 4
    (186)
    Innovative Marketing Ideas: Charts for Process Excellence
    ID: #PC01021
    $15.00
  • like 4
    (551)
    Bank Security PowerPoint Charts: Fortify Your Financial Presentations
    ID: #PC00981
    $18.00
  • like 5
    (1167)
    Managed Security Services Provider PowerPoint Charts Template
    ID: #PC00291
    $23.00
  • like 3
    (1046)
    Productivity PowerPoint Chart Template: Enhance Finance Efficiency
    ID: #PC00933
    $24.00
  • like 5
    (184)
    Marketing Research PowerPoint Charts: Unlock Data-Driven Insights
    ID: #PC00928
    $24.00
  • like 4
    (719)
    Process Infographic PowerPoint Charts Template
    ID: #PC00893
    $20.00
  • like 2
    (768)
    Inbound Marketing Strategies PowerPoint Charts Template: Fuel Your Growth
    ID: #PC00884
    $18.00
  • like 3
    (692)
    Enterprise PowerPoint Charts Template: Elevate Business Insights
    ID: #PC00883
    $14.00
  • like 3
    (148)
    Analysis of Business Needs PowerPoint Charts: Infographic Mastery
    ID: #PC00869
    $15.00
  • like 4
    (414)
    Business Puzzles with Answers PowerPoint Charts Template
    ID: #PC00851
    $18.00
  • like 2
    (148)
    Making Ideas Happen PowerPoint Charts Template
    ID: #PC00850
    $15.00
  • like 5
    (232)
    Agile Scrum Development Process PowerPoint Charts Template
    ID: #PC00830
    $15.00
  • like 4
    (722)
    Agile Scrum Methodology Process Flow PowerPoint Charts
    ID: #PC00829
    $18.00
  • like 4
    (436)
    Leader PowerPoint Charts Template for Presentation
    ID: #PC00827
    $12.00
  • like 3
    (266)
    Scrum Process Flow PowerPoint Charts Template
    ID: #PC00795
    $20.00


Elevating Organizational Clarity Through Charts

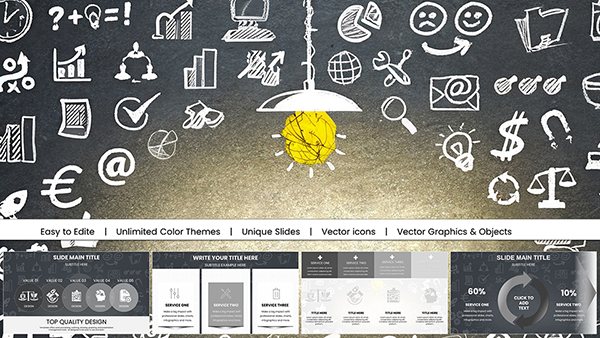
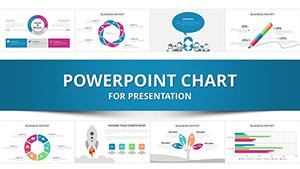
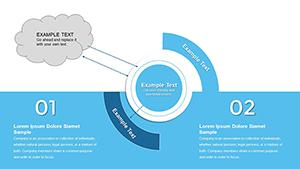
PowerPoint charts in our library go beyond basics, incorporating smart connectors and auto-align features for flawless layouts. Default charts lack the finesse; ours deliver with layered transparency and gradient scales for depth.

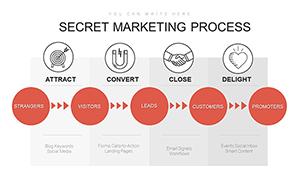
Aimed at corporate trainers and operations managers, they support scenarios like visualizing supply chains or talent pipelines. The result? Audiences grasp concepts faster, leading to more productive discussions.

  • Comprehensive Types: Gantt, Venn, bubble - for varied organizational insights.
  • Animation Controls: Sequence reveals to guide viewer focus.
  • Export Options: High-res for prints or embeds.

Industry-Specific Applications

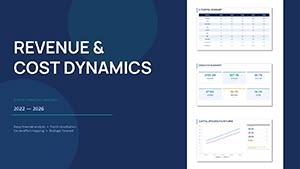
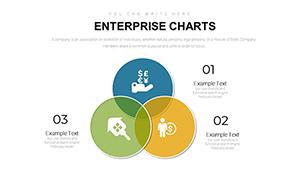
Finance teams chart budget allocations with stacked bars; HR uses pyramid diagrams for career ladders. These tailored uses demonstrate versatility, turning data into strategic assets.

Superior to generic libraries, our templates embed best-practice spacing and fonts, enhancing readability on large screens.

Optimization Strategies for Charts

Choose scales that fit your data range - logarithmic for vast disparities. Add tooltips for interactivity in digital formats, and maintain white space to avoid overcrowding.

For global teams, opt for universal symbols over text-heavy labels. These habits ensure inclusive, effective communication.

Boosting Team Efficiency with Visual Aids

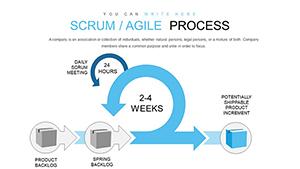
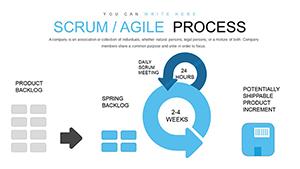
Integrate charts into collaborative workflows by sharing editable links, allowing real-time input. In agile environments, timeline charts track sprints, aligning efforts seamlessly.

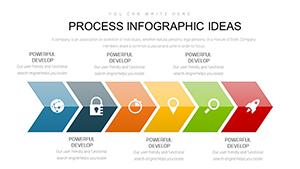
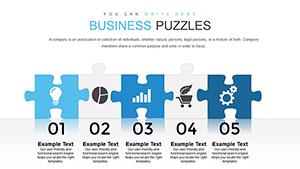
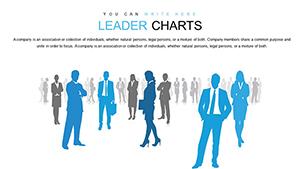
Infuse creativity with custom icons - gears for processes, people silhouettes for roles - making slides relatable and fun.

  1. Validate data accuracy before charting.
  2. Layer info for progressive disclosure.
  3. Pair with narratives for context.

Growth-Focused Chart Designs

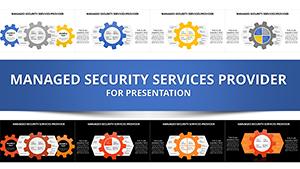
Enterprise users scale with multi-slide chart suites, tracking evolution over time. A manufacturing client visualized production lines, identifying bottlenecks and increasing output by 25%.

Our edge: Parametric adjustments for instant resizing, far beyond static defaults.

Creative Twists on Traditional Charts

Experiment with hybrid visuals, like mind maps fused with metrics, for brainstorming sessions. Dark-themed variants suit evening pitches, maintaining visibility.

Ready for clarity? Download organizational charts and refine your approach.

Frequently Asked Questions