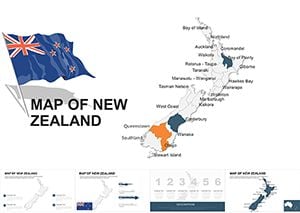
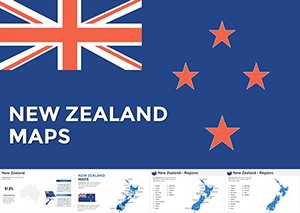
Chart the diverse terrains of Aotearoa with our New Zealand map templates optimized for Keynote. These vector masterpieces delineate 16 regions, major cities like Auckland and Wellington, and iconic features from fjords to volcanoes, empowering storytellers to spotlight locales with precision. Geared toward travel agents, exporters, and environmentalists, the designs fuse minimalist lines with vibrant accents in fern greens and ocean blues for an authentic Kiwi vibe.
Whether mapping tourism routes or trade corridors, these templates enable layered annotations - pin hotspots for demographics or overlay routes for logistics. Consultants in sustainability use them to visualize conservation efforts, while schools integrate for geography modules with drag-and-drop interactivity. The vector format guarantees scalability, from thumbnail overviews to full-screen immersions, without jagged edges.
Key benefits include color-coded legends for instant categorization and shape tools for custom territories, streamlining complex spatial narratives. Effortlessly import stats via Keynote`s data features for dynamic updates. Venture through our assortment and map your message with the elegance of New Zealand`s contours.
New Zealand map templates in Keynote transcend flat diagrams, embedding cultural and geographic depth that generic globes lack. Defaults might outline borders, but these capture essence - shaded relief for Southern Alps or dotted icons for Maori sites - fostering emotional connections. In export seminars, highlight supply chains from Northland farms to Southland ports, using curved paths that follow real highways.
For adventure tourism pitches, animate region reveals to build anticipation, outshining static images with narrative progression. The vector advantage: Recolor for seasonal themes, like autumn golds over Canterbury plains, without resolution dips.
Practice tip: Anchor maps with compass roses for orientation, ensuring 80% map, 20% text for visual dominance. Unique edge: Pre-linked hyperlinks to external resources, like Stats NZ, for enriched decks. Creatively, morph islands to simulate tectonic shifts in geology talks.
Harness Keynote`s bezier tools to refine coastlines or add custom icons like kiwi birds for cultural nods. Example: A winery exporter maps vintage zones, with editable bubbles sizing by yield, dynamically resizing with data pulls. This interactivity captivates, surpassing printed atlases by lightyears.
Versus basic outlines, these include elevation tints and urban-rural dichotomies, cutting research time in half. In heritage presentations, layer historical overlays - pre- and post-Treaty of Waitangi - for temporal depth.
Best approach: Use master slides for consistent projections, maintaining Mercator fidelity across variants.
Navigate success - download a map and plot your course. Your story`s terrain awaits.
All 16 official regions plus territorial authorities, fully labeled.
Yes, via Keynote`s chart tools linking to CSV imports.
Optimized for equal-area views to preserve proportions.
Inset frames allow detailed zooms without cluttering mains.
Fully responsive for touch-based edits on the go.
Discover down under - secure your template and map magnificence.
Copyright © 2009-2026 ImagineLayout All rights reserved.