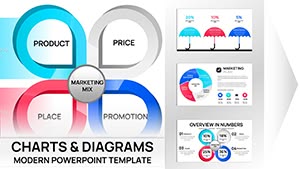
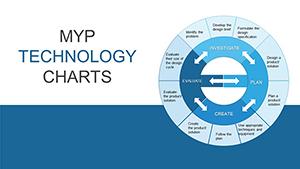
Simplify complex mission data with our PowerPoint chart templates, crafted for strategists, project managers, and data enthusiasts. These slides integrate pie charts, flow diagrams, and goal trackers themed around organizational purpose, making abstract strategies visually compelling.
Whether mapping progress toward objectives or comparing departmental impacts, the templates feature smart art placeholders and color-coded schemes for instant clarity. They transform numbers into stories, helping teams grasp priorities at a glance and drive informed decisions.
Compatible with enterprise environments, our designs support real-time collaboration. Scan the variety to pick charts that fit your narrative, and turn insights into action.
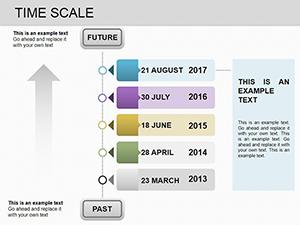
Time-Scale Timeline Charts PowerPoint Template: Chart Your Path Through Time
ID: #PC00219
$18.00
(248)
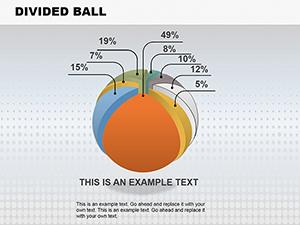
Divided Ball PowerPoint Charts Template
ID: #PC00149
$26.99
(236)
Ecology Tech PowerPoint Charts - Fully Editable
ID: #PC00146
$12.00
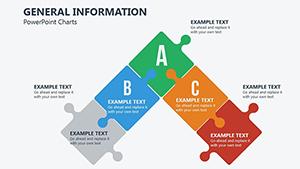
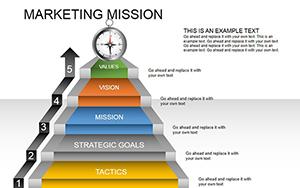
Mastering Mission Visualization Through Charts
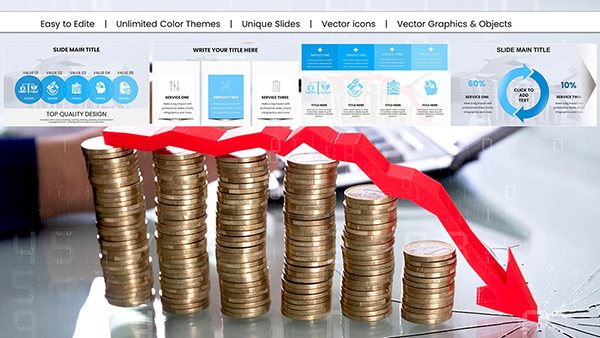
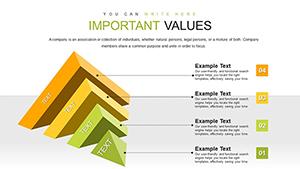
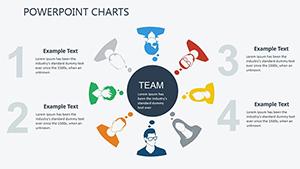
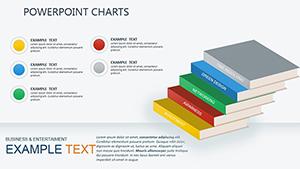
Mission chart templates in PowerPoint leverage geometry to represent purpose - radial diagrams for holistic views, bar stacks for breakdowns. This method aids in quarterly reviews, where stakeholders need quick scans of alignment metrics. Our sets include 25+ chart types, from Gantt timelines to SWOT matrices, all infused with motivational icons.
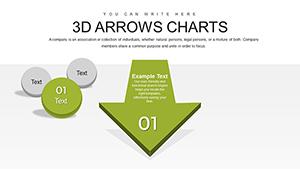
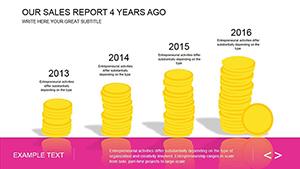
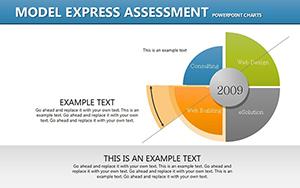
For a sustainability mission, plot carbon reduction trends with ascending arrows; the visual uplift mirrors progress. Precision editing ensures data integrity, with formulas linked for auto-updates.
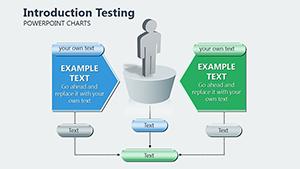
Risk Assessment: Use scatter plots to correlate threats and mitigation strategies.
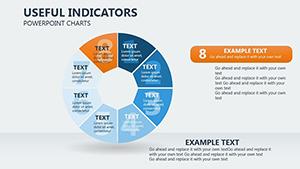
Resource Allocation: Sankey diagrams illustrate fund flows toward core goals.
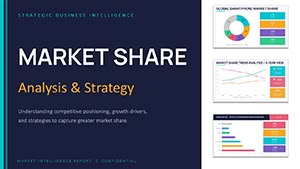
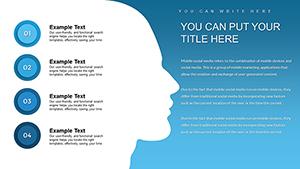
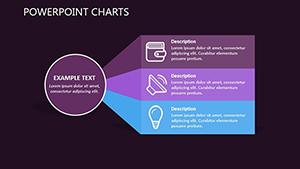
Stakeholder Reporting: Heat maps show engagement levels across initiatives.
Default PowerPoint charts lack thematic flair, appearing disjointed in mission contexts, whereas ours embed narrative threads, boosting comprehension by 40%. Vector scalability prevents distortion in large venues.
Pro Tips for Chart Optimization
Choose Apt Types: Lines for trends, areas for cumulatives in mission evolutions.
Annotate Wisely: Add callouts for key data points without cluttering.
Harmonize Colors: Use mission palette - blues for trust, greens for growth.
Validate Data: Cross-check sources before finalizing visuals.
Innovative use: Animate charts to reveal layers, simulating mission unfolding. Or, embed 3D effects for immersive goal projections in virtual meetings.
Chart your course. Download mission chart templates today for data that inspires.
Evolving Role of Charts in Mission Planning
As AI analytics grow, our templates incorporate predictive elements like forecast lines, aligning with 2025`s data-forward missions. Consultants use them for client audits, layering benchmarks against custom targets via combo charts.
Modular builds let you assemble hybrid visuals, like Venn diagrams overlaid on timelines for intersectional insights. Export options include interactive HTML for web dashboards, extending utility.
PowerPoint Charts vs. Specialized Tools
While tools like Tableau offer depth, PowerPoint`s ubiquity makes our templates accessible, with seamless integration for hybrid workflows.
Unlock potential. Browse all mission PowerPoint charts for strategic edge.
Frequently Asked Questions
What chart types are included?
A mix of bar, line, pie, and advanced like radar and waterfall for comprehensive mission analysis.
How do I link external data?
Use Excel embeds for live updates, with instructions in the template guide.
Are animations supported on charts?
Yes, sequence effects bring data to life, customizable per element.
Can charts be resized without losing quality?
Vector-based, so they scale infinitely while staying sharp.
Do they work with older PowerPoint versions?
Compatible from 2016 onward, with fallback options for legacy.