Organizational Behaviour PowerPoint Charts Template


Type: PowerPoint Charts template
Category: Organizational
Sources Available: .pptx
Product ID: PC00330
Template incl.: 28 editable slides
Navigating the intricacies of human behavior in workplaces is both an art and a science, and our Organizational Behaviour PowerPoint Charts Template is your canvas. With 28 editable slides, this resource delves into core aspects like motivation, leadership, communication, and team dynamics, providing visual tools to make abstract concepts concrete. Perfect for HR professionals, managers, and trainers aiming to foster better work environments, it draws from established frameworks such as Maslow's hierarchy or Herzberg's two-factor theory. Imagine presenting employee engagement data in a way that sparks real dialogue and change - this template does just that. By simplifying complex topics through charts, it helps you save time on design while focusing on content that drives organizational success. Whether addressing turnover issues or promoting collaboration, these slides turn data into stories that resonate, enhancing retention and persuasiveness in your sessions.
Standout Features for In-Depth Analysis
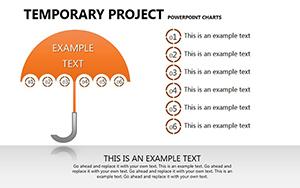
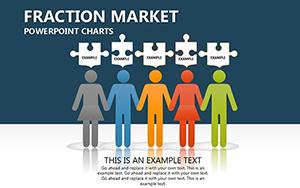
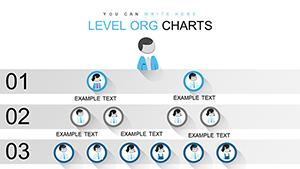
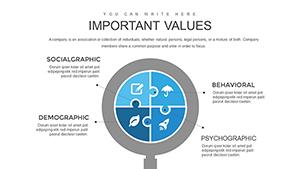
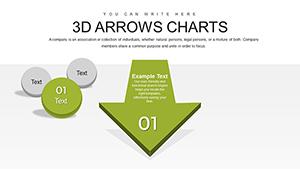
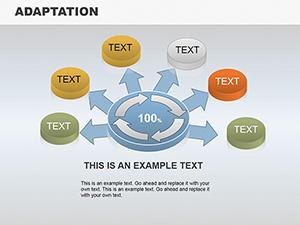
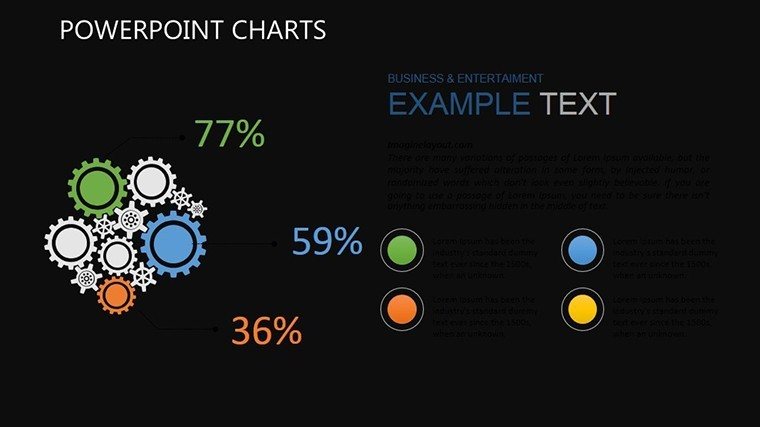
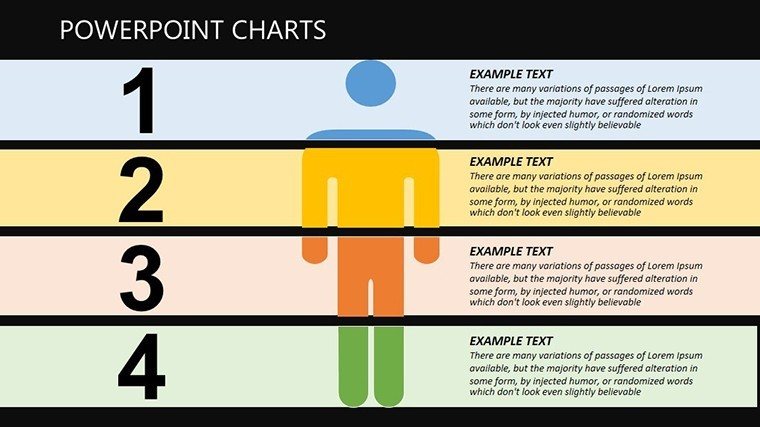
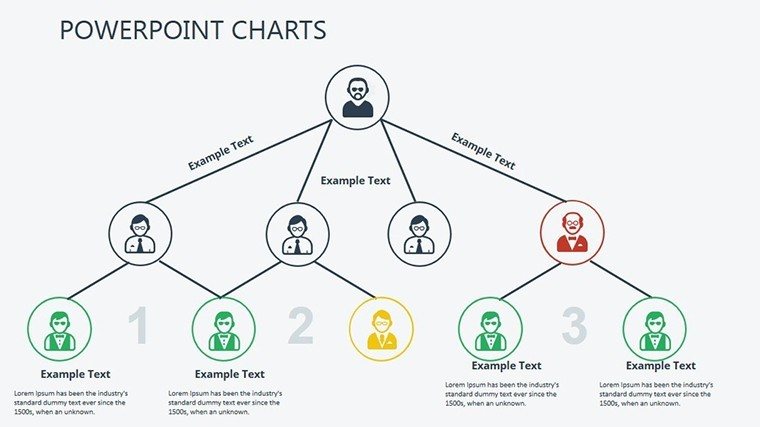
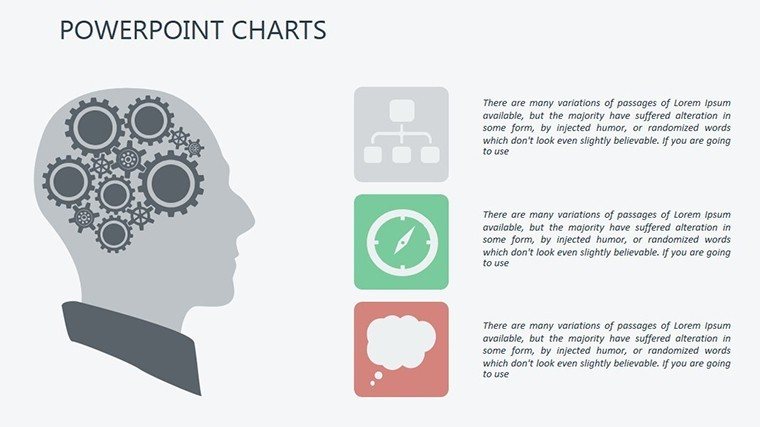
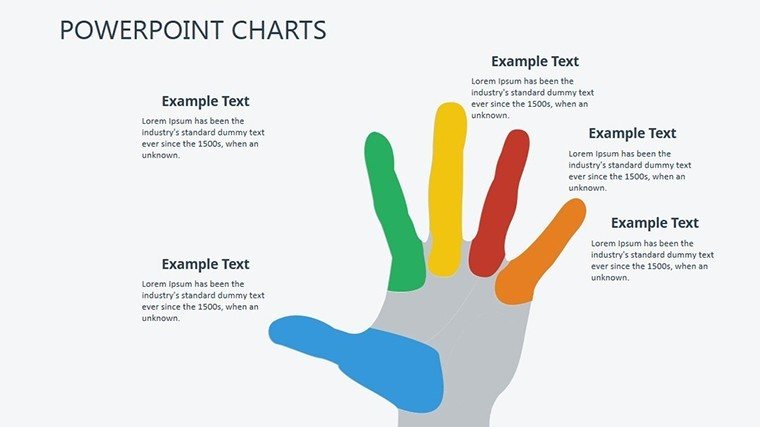
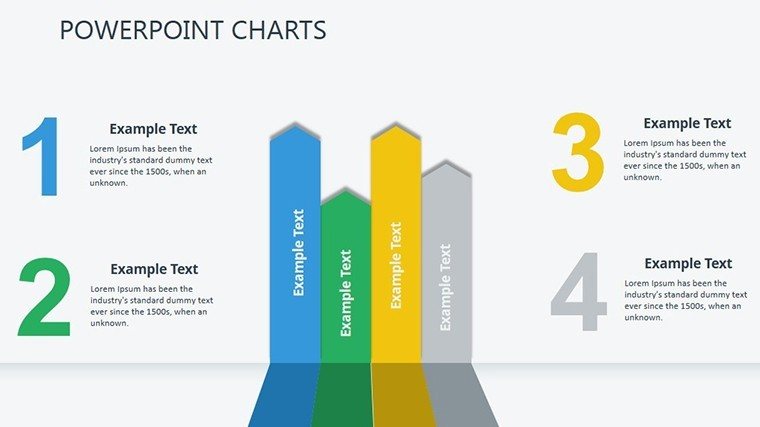
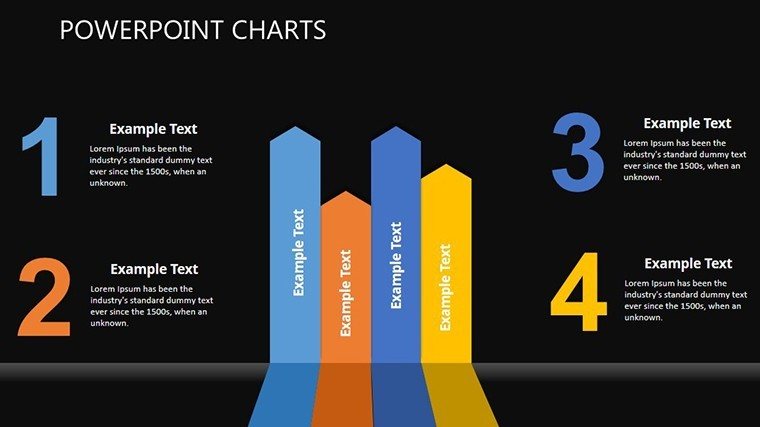
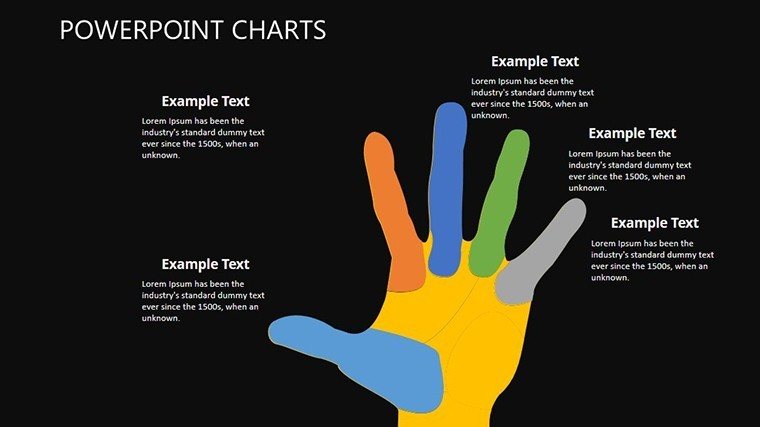
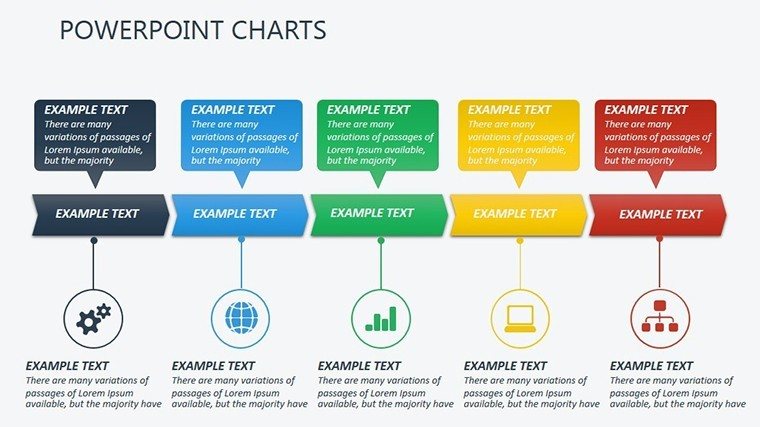
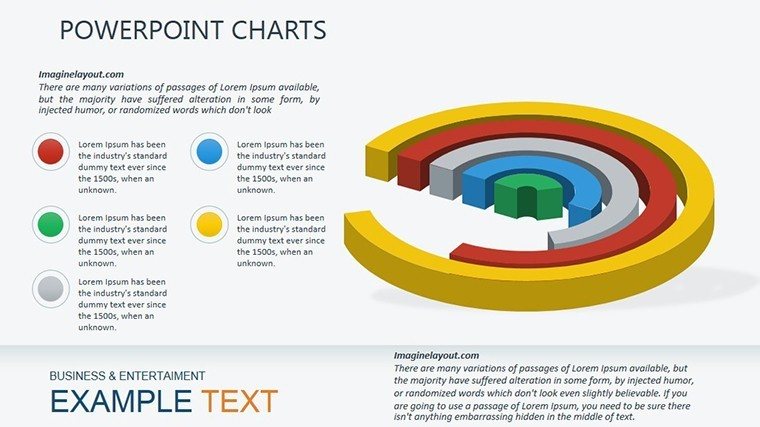
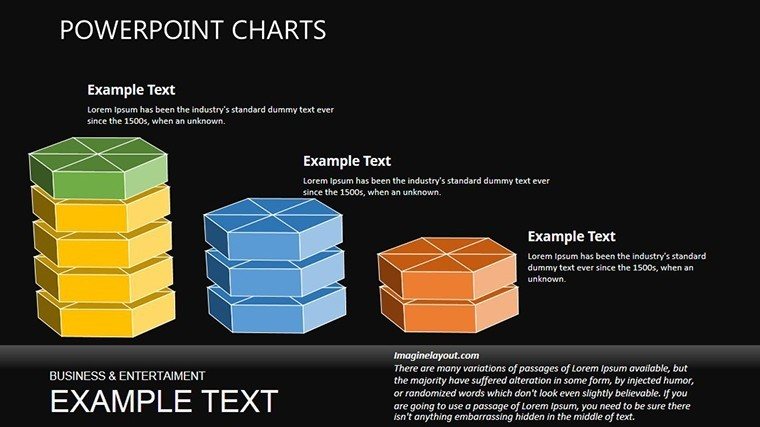
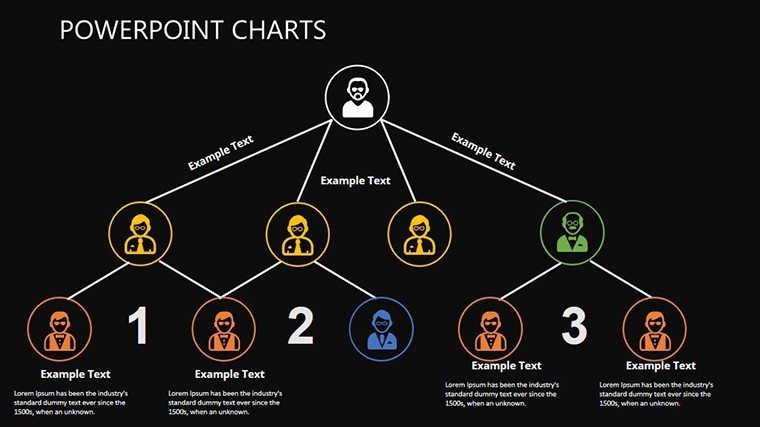
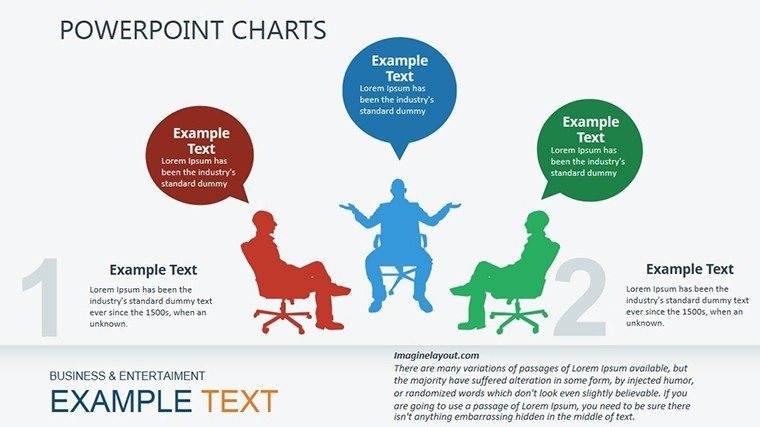
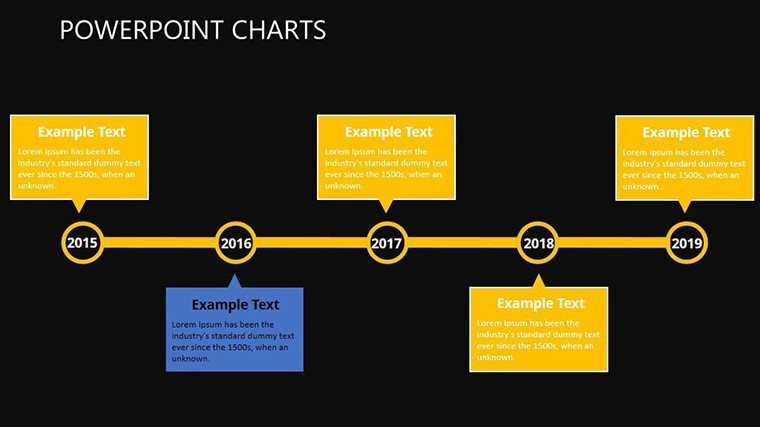
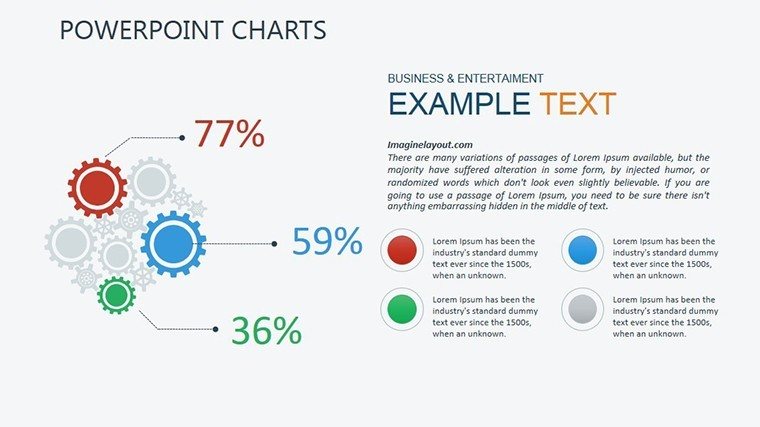
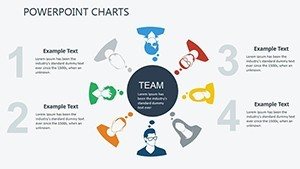
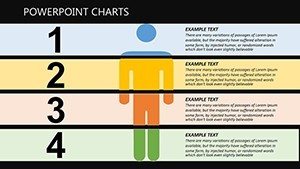
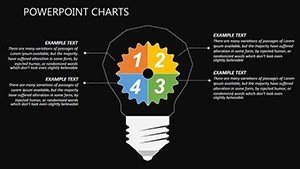
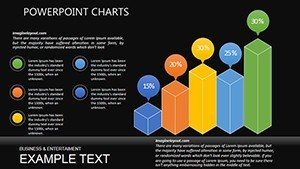
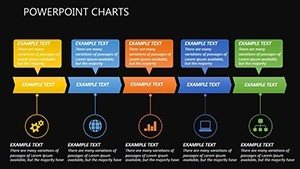
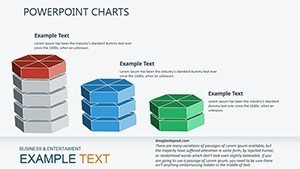
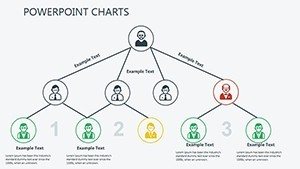
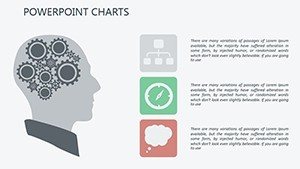
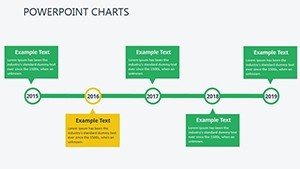
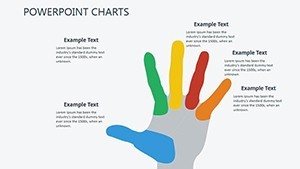
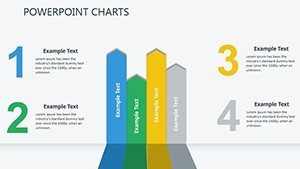
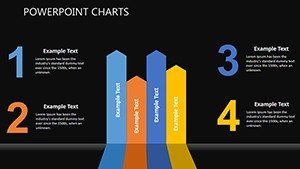
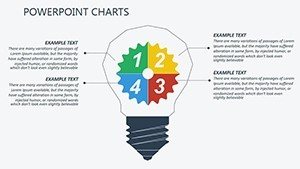
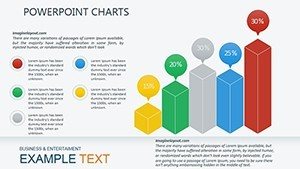
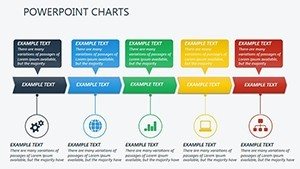
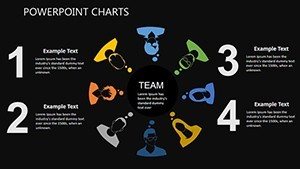
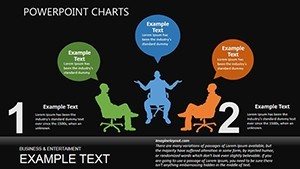
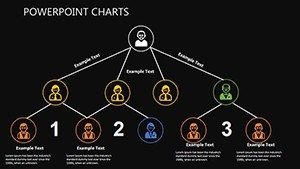
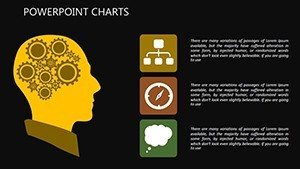
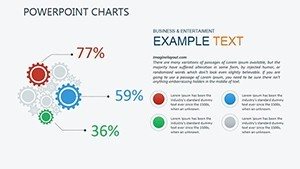
The template's strength lies in its diverse chart types: Bar graphs for performance metrics, pie charts for survey breakdowns, and flowcharts for process flows. Each is fully interactive, with clickable elements for deeper dives. Compatibility with PowerPoint ensures smooth operation, and pre-designed themes in neutral tones promote professionalism. Unlike generic slides, these include specialized icons for behaviors - like lightbulbs for ideas or handshakes for teamwork - adding contextual richness. Animations reveal layers progressively, ideal for building arguments step by step.
Tailoring for Specific Needs
Customization is straightforward: Edit data via integrated tables, change fonts for branding, or add multimedia. For example, adapt a leadership matrix to your company's structure, ensuring relevance.
Practical Use Cases and Scenarios
Consider a case where a Fortune 500 company uses these charts to visualize engagement survey results, identifying motivation dips and implementing fixes that improve satisfaction by 25%. HR teams can track performance over time, highlighting trends in team dynamics. In training, illustrate change management stages, referencing Kotter's model for authority. Step-by-step: Select a theme slide, populate with your data, customize visuals, incorporate examples, and present with confidence. Consultants apply it in workshops, drawing from real studies like Google's Project Aristotle on team effectiveness. Educators use it for lectures on organizational theories, making concepts accessible. This integrates with tools like SurveyMonkey for direct data import.
Superior to Default Options
Basic PowerPoint lacks the thematic depth; our template offers pre-built narratives, reducing prep time by 40% and increasing audience engagement through visuals.
Insights from Organizational Experts
Leverage tips like starting with key questions: What behaviors drive success? Use visuals to support, not overwhelm. Cite credible sources like APA journals for trust. Vary chart types for interest, ensuring accessibility. These draw from E-A-T to position you as a thought leader.
Transform your organizational insights - download and lead with clarity.
Frequently Asked Questions
How do I customize the behavior-themed icons?
Select the icon, right-click to edit, and replace or recolor as needed.
Does it support data from external surveys?
Yes, import directly from Excel or CSV for accurate representations.
Are the slides suitable for virtual presentations?
Absolutely, optimized for Zoom and Teams with clear visuals.
Can I add more interactive elements?
Yes, embed hyperlinks or triggers for enhanced engagement.
What theories are best visualized here?
Motivation models like Maslow's or leadership styles like transformational.
Is there a guide for beginners?
Included notes provide tips for effective use.