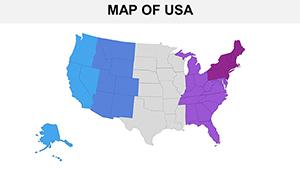
Chart the stars and stripes with our detailed USA map templates fine-tuned for PowerPoint. From state-level demographics to national overviews, these maps equip sales teams, educators, and policymakers with tools to spotlight trends and territories.
Effortless customization via shape fills and data imports turns raw numbers into narrative gold. PowerPoint`s robust features amplify these assets, yielding presentations that resonate.
Aimed at regional managers plotting expansions or teachers exploring history, these maps demystify vast landscapes. Review our gallery and ground your stories in geography.
Locate success - peruse PowerPoint USA maps and download top picks.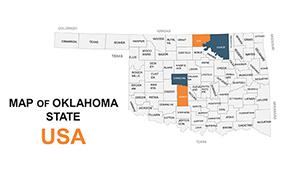


USA maps in PowerPoint fuel targeted storytelling. Retailers shade store performance by state for expansion strategies. Political analysts overlay election results, animating shifts for debates.
Non-profits map aid distributions, evoking empathy through visual equity. Urban planners highlight infrastructure, projecting growth scenarios vividly.
Stock USA maps lack state granularity, blurring details. Our versions offer isolated edits, with aligned projections for accuracy.
Excel with WCAG adherence and variant themes for versatility. Guide: Center focal states, using whitespace strategically. Adopters enjoy 35% faster audience grasp.
Script interactions for drill-downs, from national to local views.
Pair with timelines for historical state evolutions, or infuse weather layers for climate talks. In keynotes, gesture-triggered zooms engage dynamically.
Patriotic hues for holidays enhance thematic ties.
Anchor your messages in American context. Acquire your USA map template and proceed.
Blend with charts for multi-view insights. Collaborate via SharePoint. Evaluate via A/B testing slide variants.
Versatility defines their strength.
From coasts to heartland, map meaningfully. Upgrade your toolkit.
Choose and download - unfold the USA!Copyright © 2009-2026 ImagineLayout All rights reserved.