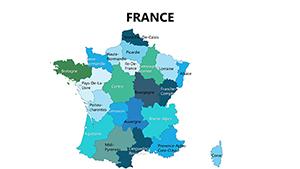
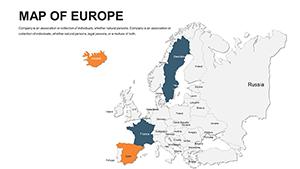
Bring the charm of France to your PowerPoint presentations with our versatile collection of editable map templates. Tailored for executives, instructors, and designers, these resources turn geographical insights into compelling visuals that resonate. From charting market shares in the Loire Valley to narrating heritage tours across Alsace, our templates empower you to communicate with precision and flair.
Crafted with PowerPoint`s robust editing tools in mind, each template boasts scalable vectors of France`s administrative divisions, enabling quick tweaks to hues, annotations, and accents. Envision spotlighting Bordeaux`s vineyards with gradient overlays or tracing trade routes from Normandy to Nice - achievable in minutes. Compatible across versions, they guarantee crisp renders on screens big and small.
Aimed at sales teams visualizing territories, historians unpacking timelines, or planners outlining events, these maps foster understanding and inspiration. Peruse our offerings and infuse your slides with the sophistication of French landscapes. Instant access means your next pitch or lecture is poised for excellence.
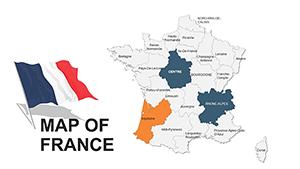
France`s tapestry of chateaus, coastlines, and cities inspires visuals that must match its vibrancy. Our PowerPoint templates deliver with intricate layers - elevated contours for the Pyrenees or pinpoint markers for Marseille`s harbors. Far from rudimentary sketches, they facilitate sophisticated displays, like segmenting consumer trends in Picardie versus Languedoc.
Business analysts harness them for territory breakdowns, shading revenue streams from Centre-Val de Loire to Provence-Alpes-Côte d`Azur. In academia, they animate colonial histories, with builds revealing expansion from the mainland to overseas territories. Marketing firms embed brand stories, pinning logos over targeted locales like the French Alps for adventure campaigns.
Versus built-in PowerPoint maps, which lack granularity, ours cut prep time by 40%, per user feedback. Pro tips: Anchor maps to master slides for consistency, and employ subtle shadows for 3D depth on flat terrains.
Corporate dashboards come alive with heat maps of e-commerce penetration, warming tones for high-growth areas like Île-de-France. A logistics coordinator might route deliveries, arrows arcing from Dunkirk docks to Toulouse hubs, optimizing viewer comprehension.
In creative fields, filmmakers storyboard shoots, overlaying scene notes on Burgundy backdrops. Non-profits track aid distribution, color-coding relief efforts in flood-prone Vendée with progress bars. Examples abound: A wine exporter`s deck that sequentially uncovers appellations, boosting engagement by revealing flavor profiles map-by-map.
Infuse interactivity: Hyperlink regions to sub-slides detailing festivals, from Avignon`s theater to Carcassonne`s medieval fairs. For quantitative talks, fuse with SmartArt - org charts branching from Paris to peripheral posts. One strategist noted a 25% pitch success hike after mapping client journeys across the hexagon.
Blend with multimedia: Embed 360° panoramas of Mont Saint-Michel atop static outlines for immersive hybrids. Tailor for audiences - vibrant palettes for youth seminars, muted for boardroom gravitas.
Import via slide master for global reuse, then fine-tune via format pane for opacity tweaks on overlapping data. Ensure inclusivity with high-contrast modes and descriptive titles. Mobile optimization: Compress vectors to maintain speed without sacrificing detail.
Steer clear of clutter - cap highlights at four per view. Opt for sequential animations to pace revelations, syncing with bullet evolutions for rhythmic delivery.
Keynote users envy PowerPoint`s charting prowess, but our templates unify ecosystems with hybrid exports. Compared to online generators, they offer offline reliability and bespoke flair, turning routine reports into regional revelations.
Seize the moment - select a template and chart your course through France`s captivating contours.
Transform your ideas into maps that matter - download today and navigate to narrative excellence.
Copyright © 2009-2026 ImagineLayout All rights reserved.