Navigate Europe`s diverse terrains with our robust Europe map templates optimized for PowerPoint. These comprehensive designs support everything from economic indicators to historical annotations, empowering analysts, policymakers, and presenters to convey spatial stories effectively.
Leverage SmartArt integrations and Excel linkages for dynamic updates, turning static maps into live dashboards. PowerPoint`s versatility shines, delivering polished results for any audience.
Geared toward researchers dissecting trends or marketers targeting regions, these maps clarify complexities. Scan our assortment and embed geography into your narratives seamlessly.
Chart your course - view PowerPoint Europe maps and download premium assets.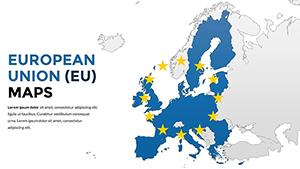
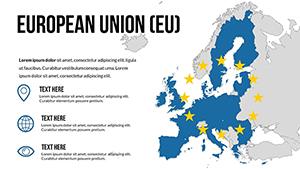
PowerPoint Europe maps adapt to numerous contexts. Economists shade GDP variances across nations for fiscal briefings. Journalists map conflict zones, layering timelines for contextual depth.
Real estate firms highlight property hotspots, integrating stats for investor pitches. Sustainability advocates use them to depict renewable energy distributions, advocating change visually.
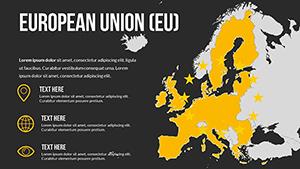
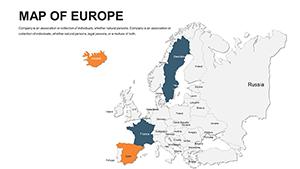
Default maps in PowerPoint are rudimentary, missing nuanced borders. Ours provide granular edits, with grouped objects for swift modifications.
Standout with alt-text compliance and high-contrast variants for inclusivity. Optimize by aligning maps to slide grids, ensuring balanced compositions. Presenters see 25% better feedback scores with these visuals.
Embed VBA macros for interactive queries, elevating basic displays to tools.
Combine with org charts for multinational structures, or animate trade flows as flowing lines. In workshops, clickable maps quiz participants, gamifying learning.
Custom palettes - vibrant for youth campaigns - tailor impact precisely.
Empower your insights with superior mapping. Download a PowerPoint Europe map and innovate.
Use pivot tables for conditional formatting, auto-tinting based on thresholds. Share via OneDrive for feedback loops. Analyze slide analytics to prioritize map types.
These highlight cross-sector utility.
Bridge data and design with excellence. Transform your slides now.
Select and save - dive into Europe!Copyright © 2009-2026 ImagineLayout All rights reserved.