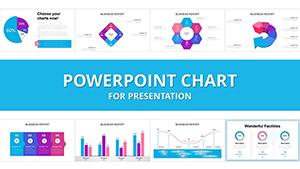
Management demands data that drives action, and our PowerPoint chart templates deliver exactly that. Geared toward leaders in finance, operations, and strategy, these designs distill insights into digestible formats like balanced scorecards and trend analyses.
From executive summaries to departmental huddles, they ensure every metric tells a story of progress or pivot. With robust editing tools, align them to your corporate palette in moments.
Harness data`s power wisely. Scan our business-focused lineup and fortify your presentations.
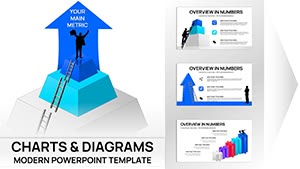
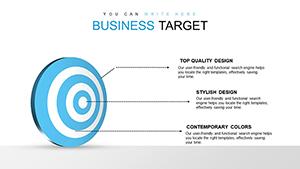
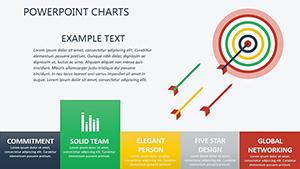
Target Online PowerPoint Charts Template: Visualize Goals with Precision
ID: #PC00412
$20.00
Strategic Data Mastery via PowerPoint Charts
Effective management hinges on visible patterns, and our templates illuminate them through specialized layouts for variance reports and portfolio balances. Suited for C-suite strategists or mid-level coordinators, they bridge raw numbers to narrative impact.
Finance teams forecast budgets, marketers dissect campaigns - all amplified by professional visuals.
Leadership-Grade Perks
Insight Acceleration: Pre-formatted for quick metric swaps.
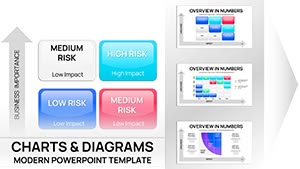
Compliance Friendly: Neutral designs for sensitive audits.
Team Scalable: Templates for solo or group editing.
Proven in High-Stakes Business Contexts
Board meetings benefit from radar charts comparing competitors, sharpening decisions. Project managers track milestones with Gantt integrations, ensuring deadlines met.
An operations VP used our dashboard template to identify inefficiencies, saving 15% in overheads annually.
Eclipsing Standard Business Charting
PowerPoint defaults handle essentials, yet lack management nuances like risk heat maps or scenario sliders. Ours incorporate these, plus Excel embeds for live data, transforming static views into strategic tools.
This sophistication correlates with elevated decision quality.
Refinement Roadmap for Managers
Focus on outcomes: Design charts around key questions, not all data.
Layer narratives: Annotations explain spikes or dips.