Lucid Keynote Charts
Bring clarity and impact to your Keynote slides with our Lucid Chart templates. Designed for professionals , these templates transform complex data into elegant visuals effortlessly.
Perfect for business reports education presentations and creative projects each template offers clean lines intuitive layouts and pastel palettes that make your message resonate.
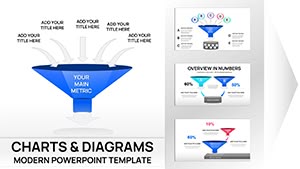
38 Flow Funnel Keynote Charts - Fully Editable | ImagineLayout
ID: #KC01112
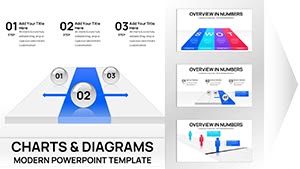
Project Tracking Keynote Charts - Editable | ImagineLayout
ID: #KC01109
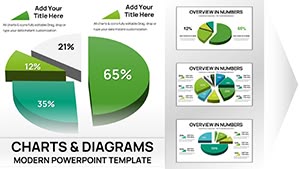
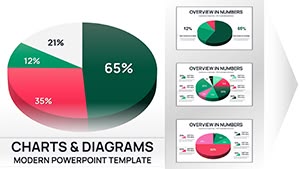
Keynote 3D Pie Chart Template - Fully Editable | ImagineLayout
ID: #KC01105
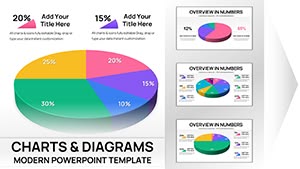
30 3D Pie Keynote Charts - Editable .key File | ImagineLayout
ID: #KC01104
36 3D Pie Keynote Charts - Editable .key File | ImagineLayout
ID: #KC01103
Reclaim Your Day: Boost Your Productivity with Keynote Charts Templates
ID: #KC00933
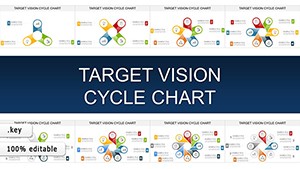
Target Vision Cycle Keynote Charts: Chart Your Bold Future
ID: #KC00912
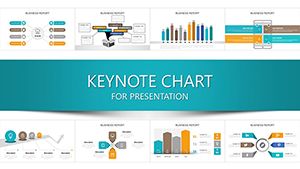
Professional Mixed Charts Keynote Template - Bar Line Pie Infographics | Fully Editable | Instant Download
ID: #KC00877
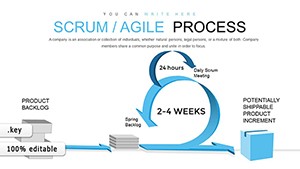
Scrum Agile Process Keynote Charts Template
ID: #KC00828
Ribbon Interconnections Charts - Editable | ImagineLayout
ID: #KC00693
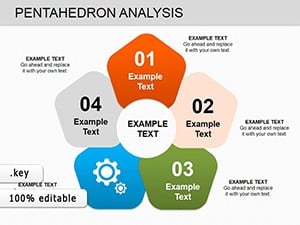
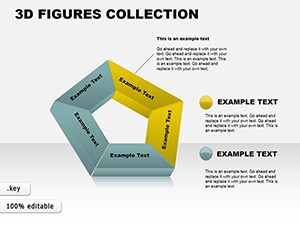
Pentahedron Analysis Keynote charts
ID: #KC00222
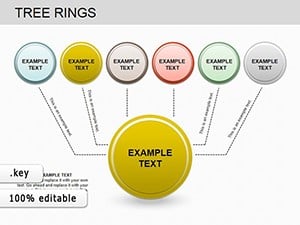
Tree Rings Keynote Charts: Reveal Nature's Timeless Secrets
ID: #KC00202
3D Hexagons Collection Keynote Charts: Elevate Data to New Dimensions
ID: #KC00085
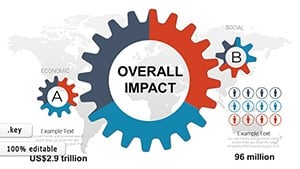
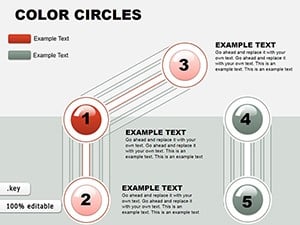
Infographic Color Circles Keynote: Orbit Your Data with Flair
ID: #KC00077
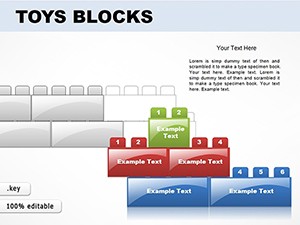
Toy Blocks Keynote Template: Playful & Professional
ID: #KC00037
Why Choose Lucid Keynote Charts Unlike default Keynote charts our Lucid-inspired templates prioritize whitespace logical hierarchies and clarity. Audiences engage more effectively with visual storytelling enhancing comprehension and retention.
Real-World Applications Business: Workflow diagrams project timelines and KPI dashboards Education: Lesson plans mind maps and historical event charts Marketing: Campaign funnels and infographic presentations Creative Projects: Storyboards scene planning and design layouts Benefits Over Default Templates Editable and scalable for any resolution Interactive elements and animation-ready Professional color harmony and clean design Creative Tips and Best Practices Use gradients and icons for thematic depth Align elements with guides for consistency Test slides across devices for optimal viewing Download your templates today and start creating visually compelling Keynote presentations that impress and inform.
Frequently Asked Questions Are these templates editable in Keynote? Yes all templates are fully editable directly in Keynote allowing you to customize text colors shapes and layout effortlessly.
Can I use these templates for business presentations? Absolutely these templates are perfect for professional reports marketing decks and workflow presentations across industries.
Do they include interactive features? Yes certain templates come with hover effects animation-ready elements and smart layouts for dynamic storytelling.
Are these templates suitable for education? Yes educators can use them to diagram lessons mind maps and historical events making learning visually engaging.
Can I export these templates for other platforms? Yes you can export finished slides as PDF images GIFs or share directly across platforms maintaining high quality.