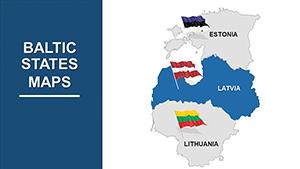
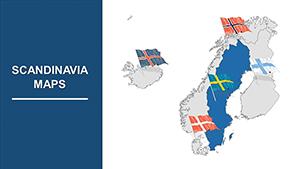
Dive into the world of global visualization with our large scale PowerPoint maps templates, crafted to bring expansive geographic data to life. These templates cover continents, countries, and oceans in high-resolution detail, perfect for illustrating trade routes, market expansions, or environmental impacts on a grand canvas.
Targeted at strategists, geographers, and international teams, they offer unmatched scalability - zoom from planetary overviews to regional highlights without pixelation. Benefits include quick integration into reports, fostering clearer strategic discussions and informed decisions.
Enhance your narratives with layered elements like heat maps or route overlays. Explore our library and select the perfect template to scale your ideas across the globe.


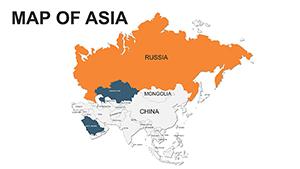

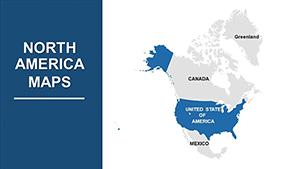
Large scale PowerPoint maps excel in providing a bird`s-eye view of complex datasets, making them indispensable for presentations that span borders. They transform abstract statistics into tangible visuals, helping audiences connect dots across vast areas. Unlike small insets that cramp details, these templates span full slides for immersive impact.
Business leaders use them to plot supply chains, while educators map historical migrations - each application amplified by the template`s breadth.
In logistics, overlay shipment routes on world maps to optimize paths, reducing costs visualized in real-time. These templates shine in boardroom decks, where large scales underscore global reach.
Researchers highlight climate zones with shaded continents, drawing attention to affected regions. The scalability ensures data integrity across projections.
Marketers craft destination overviews, using interactive elements to engage potential clients with panoramic views.
Compared to default PowerPoint shapes, which require manual drawing and often distort, our large scale templates come pre-vectorized for flawless resizing and professional polish.
Start with a base layer for topography, then build with thematic overlays. Limit color palettes to four for clarity, and incorporate legends for self-explanatory slides. Test animations like fade-ins on regions to guide viewer focus progressively.
What sets these apart is embedded data links - import CSV files directly to auto-populate metrics on countries. This streamlines updates for live demos, a step beyond static images.
Creative twist: Combine with timeline sliders to show changes over decades, ideal for forecasting presentations.
Expand your horizons with precision. Browse large scale PowerPoint maps templates and download your favorite to start mapping today.
Copyright © 2009-2026 ImagineLayout All rights reserved.