Knowledge PowerPoint Charts
Knowledge chart PowerPoint templates illuminate concepts for trainers, researchers, and knowledge managers, using mind maps, hierarchies, and flows to connect dots. They distill vast info into navigable visuals, sparking deeper comprehension.
Perfect for workshops on learning theories, corporate knowledge bases, or student study aids, these templates adapt to any depth, from basics to intricacies.
In PowerPoint, enjoy auto-layouts that reorganize on edits and export options for posters or webs. Opt for radial webs or linear trees to suit your narrative.
Tap into our knowledge charts now and architect presentations that build lasting understanding.
Global Finance Analytics PowerPoint Charts Template (18 Slides)
ID: #PC01139
Cyclical Balls Charts Template for PowerPoint - 40 Slides
ID: #PC01083
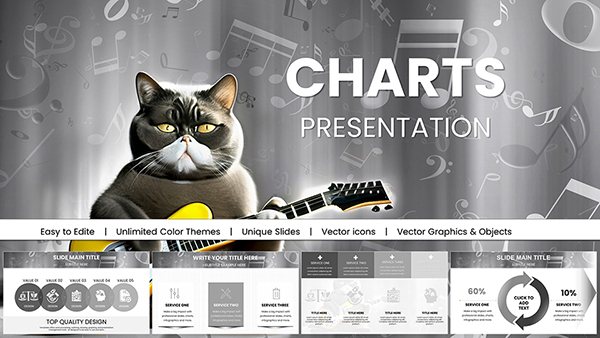
Music PowerPoint Charts Template - Harmonize Ideas
ID: #PC01035
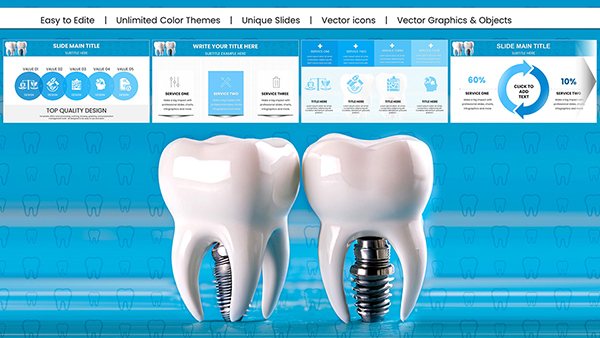
Dental Implant PowerPoint Charts: Precision for Medical Pros
ID: #PC01025
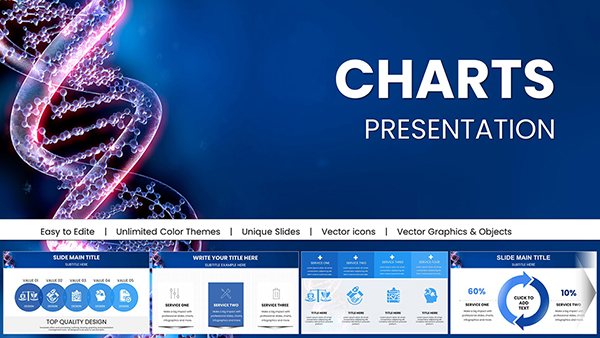
Stunning DNA Genome PowerPoint Charts Presentation: Bring Genetics to Life
ID: #PC01016
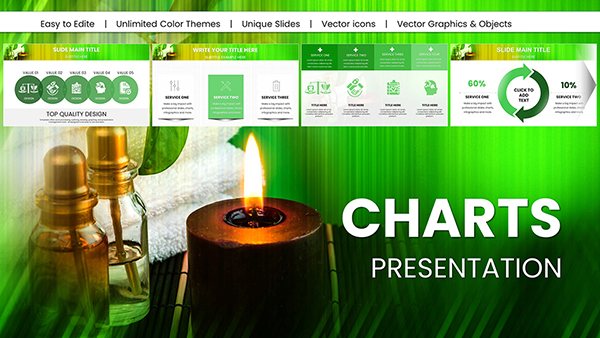
Professional Spa Procedures PowerPoint Charts Template: Optimize Your Wellness Business
ID: #PC01015
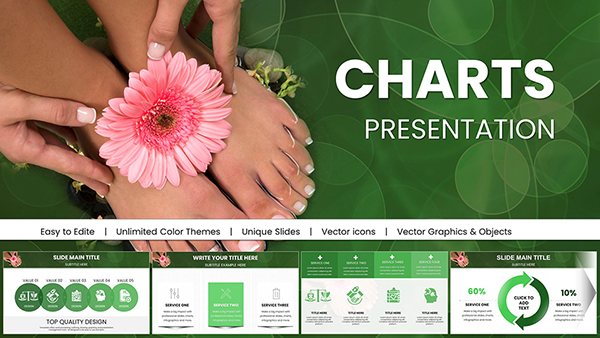
Spa Treatments PowerPoint Charts Presentation
ID: #PC01011
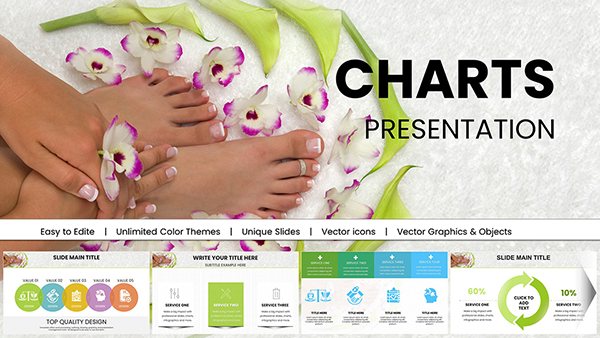
SPA Foot Treatment PowerPoint Charts Template
ID: #PC01010
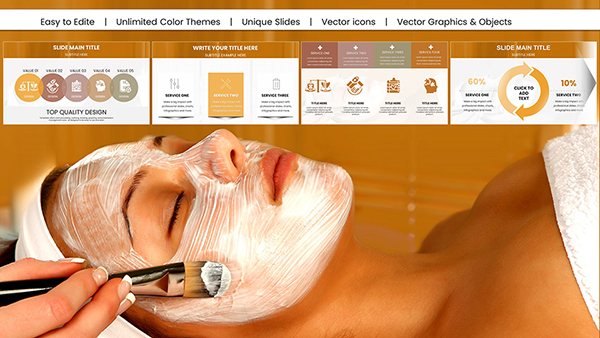
DIY Face Mask Spa PowerPoint Charts: Transform Wellness Presentations
ID: #PC01005
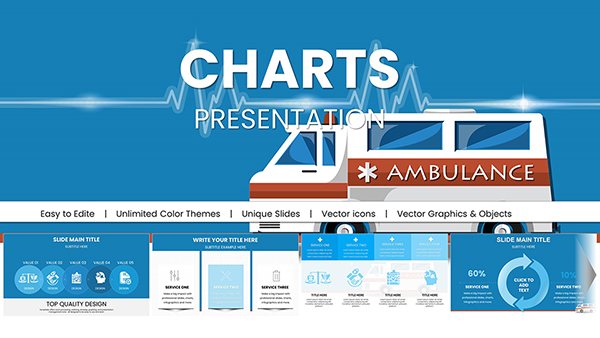
Design Ambulance PowerPoint Charts: Empower Medical Communications
ID: #PC00975
Vitamin A Carotenoids Presentation Charts Template
ID: #PC00949
Fats and Oils PowerPoint Charts Template - Nutrition Data Visualization Slides | Fully Editable | Instant Download
ID: #PC00947
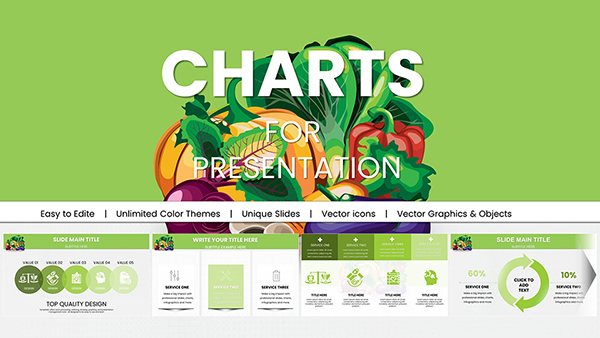
Healthy Food PowerPoint Charts: Your Toolkit for Wellness Wisdom
ID: #PC00946
Fruits PowerPoint Charts Template: Infuse Freshness into Your Presentations
ID: #PC00945
Vegetable PowerPoint Charts & Greengrocery Templates for Engaging Presentations
ID: #PC00944
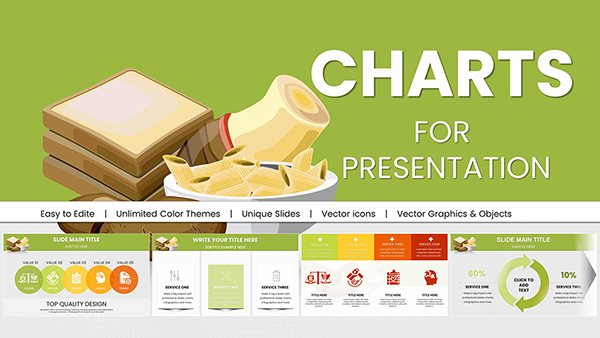
Food Products PowerPoint Charts: Templates for Nutrition and Industry Insights
ID: #PC00943
Best Choice PowerPoint Charts: Professional Templates for Decision-Making
ID: #PC00939
Devices PowerPoint Chart Template: Transform Tech Data into Engaging Visuals
ID: #PC00888
Craft Compelling Narratives: Visual Portfolio PowerPoint Charts Template
ID: #PC00886
Healthy Foods Infographic PowerPoint Charts Template: Your Guide to Nutrient-Rich Presentations
ID: #PC00881
Medicine: Personal Protective Equipment (PPE) PowerPoint Charts Template
ID: #PC00878
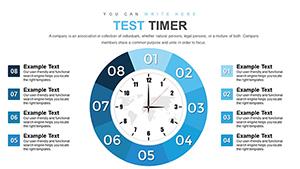
Time Clock Dial PowerPoint Charts Template
ID: #PC00874
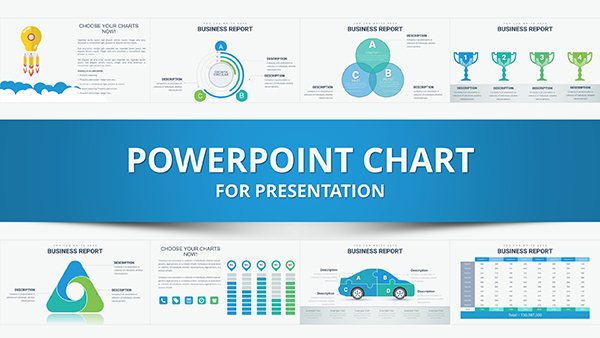
Legitimate Business Success PowerPoint Charts Template: Unlock Professional Excellence
ID: #PC00872
Catalog Choice PowerPoint Charts: Master Infographics
ID: #PC00865
Broad Applications in Knowledge Sharing Trainers deploy for onboarding, diagramming org know-how. Academics visualize theories, like Bloom`s taxonomy pyramids. Librarians catalog resources via interconnected nodes.
Teams map innovation pipelines, identifying gaps. Consultants outline expertise inventories for clients.
Training Modules: Flow skill acquisition paths.Research Overviews: Cluster findings thematically.Brainstorm Sessions: Branch ideas collaboratively. Enhanced vs. Everyday PowerPoint Diagrams Default shapes connect clumsily; our knowledge templates use semantic groupings, like color-coded domains, for intuitive scans. Basics don`t scale narratives - ours layer depths with expanders.
Smart connectors auto-reroute, saving redesign time.
Distinctions Table Strength Knowledge Templates Standard Diagrams Conceptual Depth Layered hierarchies Flat connections Adaptability Auto-reorganize Fixed positions Engagement Interactive zooms Static views
Mastering Knowledge Visuals Prioritize centrality - place core ideas at hubs. Use gradients for importance gradients. Facilitate discussions with clickable branches.
Highlight: A think tank`s epistemology map revolutionized debates, clarifying paradigms. Hyperlink to sources for credibility.
Get knowledge chart templates .
Trailblazing Techniques and Impacts Experiment: Embed quizzes in nodes for active learning. For enterprises, integrate with LMS via exports.
Impact: A university`s curriculum redesign via these charts improved retention 25%. Customize for cultures with symbolic icons.
Animate growth for evolutionary concepts. Print as foldable maps. Update via data feeds. Unlock potentials.
Frequently Asked Questions Types of charts available? Mind maps, Venn, trees, and custom knowledge webs.
Group editing support? Share via OneDrive for concurrent contributions.
Beginner-friendly? Guided templates with tooltips ease entry.
Export formats? PDF, image, or interactive HTML.
Scalable for large datasets? Yes, with zoom and filter functions.
Connect the dots brilliantly.