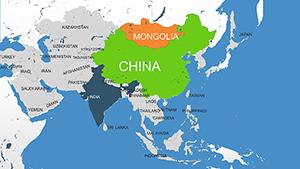
Chart India`s vast geography effortlessly using our specialized PowerPoint map templates, from detailed state boundaries to topographic overlays. Designed for geographers, market researchers, or travel planners, these tools turn data into digestible visuals with pinpoint accuracy.
Vector-based for unlimited zooming, they support color-coding for demographics or trade flows, integrated seamlessly into your decks. Enhance spatial storytelling without design hurdles.
These maps not only inform but illuminate patterns, aiding decision-making across fields. Scan our collection and map out your success story today.
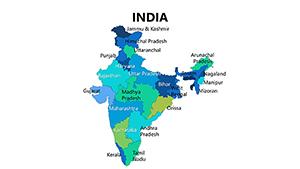
India`s 28 states and 8 union territories form a complex mosaic of regions, each with unique contours and stories. Our PowerPoint map templates simplify this complexity, offering layered designs that facilitate targeted annotations and highlights.
Urban planners zoning developments or educators tracing migration routes leverage these for precise, engaging content.
Unlike static images, our interactive vectors allow real-time adjustments for dynamic sessions.
Built with PowerPoint`s shape tools, they include grouping for easy isolation of areas like the Deccan Plateau. Best practices: Apply consistent legends for universal readability.
A monsoon impact map features flood-prone zoning, vital for disaster prep talks.
These methods empower data-driven narratives in boardrooms or classrooms.
With features like elevation contours, maps reveal terrain influences on culture. In climate reports, they depict drought zones, prompting strategic responses.
Analysts achieve clearer buy-in when visuals demystify spatial data.
Employ earth-tone schemes for natural fidelity. Test zoom levels for projection clarity, and add ARIA labels for accessibility.
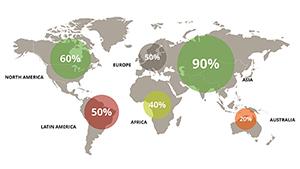
Integrate pie charts on districts for localized stats.
Vector format ensures infinite scalability without pixelation.
Yes, major cities marked with customizable pins.
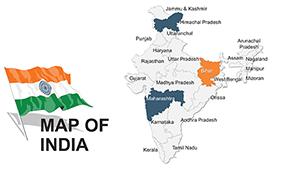
Recolor paths and fills to match presentation palettes.
Fully, with distinct styling for Andaman or Lakshadweep.
Yes, to PDF or SVG for broader compatibility.
Geared to graph India`s grid? Choose a map template and plot your path forward.
Copyright © 2009-2026 ImagineLayout All rights reserved.