Elevate your presentations with our interactive Google Maps PowerPoint templates designed for marketers analysts and educators. Visualize data effortlessly and communicate insights with precision using customizable pins heatmaps and routes.
Whether plotting business expansion strategies educational lessons or marketing campaigns these templates transform complex location data into compelling visual stories. Integrate live Google data seamlessly and reduce prep time while impressing your audience.
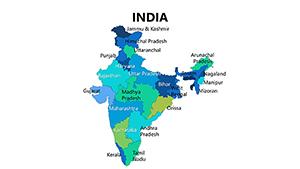
Complete India PowerPoint Maps Presentation: Weave Stories of Diversity
ID: #PM00081
$25.00
(200)
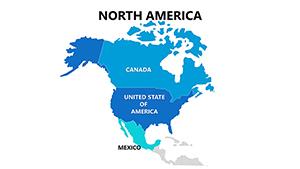
Collection of North America PowerPoint Maps: Elevate Your Global Presentations
ID: #PM00078
$18.00
(130)
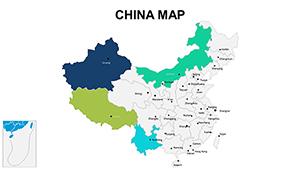
Administrative China PowerPoint Maps Template: Elevate Your Regional Insights
ID: #PM00069
$18.00
Why Choose Google Maps PowerPoint Templates
Our templates offer dynamic visuals beyond standard maps. Interactive layers allow zoomable details real-time updates and precise annotations for business logistics education or marketing analysis.
Real-World Use Cases
Marketing campaigns: visualize ad reach with city heatmaps
Educational lessons: animate historical or geographical events
Business planning: analyze territories and forecast logistics
Non-profits: map aid distribution for transparency
Benefits vs Default Templates
Unlike basic maps these templates provide live data integration interactive layers and time-saving automation for professional results.
Creative Tips and Best Practices
Limit layers to three per slide for clarity
Use consistent color schemes
Leverage alignment tools for precise pin placement
Include legend translations for global audiences
Select a template now and chart your path to persuasive mapping.
Frequently Asked Questions
Can I update the maps in real-time?
Yes these templates support live Google Maps data ensuring your slides always display current information.
Are the templates editable in PowerPoint?
All elements including pins routes and heatmaps are fully editable directly within PowerPoint.
What industries benefit most from these templates?
Marketing logistics education travel and non-profit sectors gain the most from these interactive mapping tools.
Can I export maps to PDF or web?
Yes interactivity can be retained in PDFs or web formats depending on export settings.
Do the templates include annotations?
Templates include custom markers with pop-up info boxes for detailed callouts.