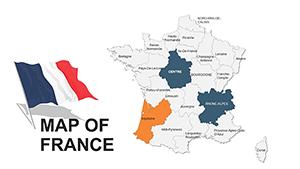
Empower your PowerPoint with geospatial prowess through our France Maps templates, designed for dissecting the nation`s layout with surgical detail. Aimed at strategists, teachers, and researchers, they facilitate explorations of everything from electoral districts to agricultural yields via intuitive map interfaces.
Vector excellence ensures maps remain sharp under scrutiny, with simple tools for highlighting rivers, mountains, or urban clusters. Integrate stats effortlessly, transforming raw numbers into geographic stories that stick.
Essential for logistics overviews or heritage tours, these assets streamline complex visuals. Review the offerings and download a template to territorialize your talks effectively.
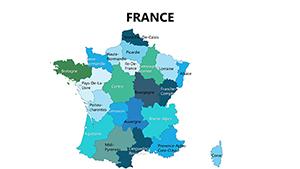

These templates transcend basic diagrams by delivering interactive France overviews that adapt to your data, ideal for professionals in policy, agriculture, and urban development who need to spatialize arguments convincingly.
They excel in contextualizing metrics for deeper understanding.
Generic tools yield pixelated messes on upscale, but our PowerPoint maps leverage shape layers for fluid edits and exports. Auto-legends and gradient fills denote variances intuitively, cutting explanation time while heightening precision. Audiences grasp concepts faster, enhancing discussion quality.
Pro strategies: Employ consistent north arrows and embed hyperlinks to detailed sub-maps for layered reveals.
Tailored for Windows and Mac PowerPoint, they support Excel data pulls for live updates and 3D extrusions for terrain pops. Styles vary from schematic wires to photorealistic bases, matching presentation tones.
Think energy sector review: Contour renewable sites over grid lines, forecasting capacities visually. This clarity drives decisions.
Set to survey your content? Browse and bag a map template to delineate your points sharply.
Yes, with entrance effects for sequential region reveals.
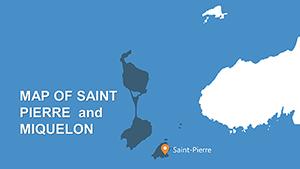
Optional insets for departments like Guadeloupe, fully editable.
Via CSV links that refresh charts on map overlays.
Standard Mercator with options for azimuthal views.
Works with PowerPoint 2016+, including Office 365.
Fortified by these FAQs, France Maps PowerPoint templates equip you for territorial triumphs - plot your course now!
Copyright © 2009-2026 ImagineLayout All rights reserved.