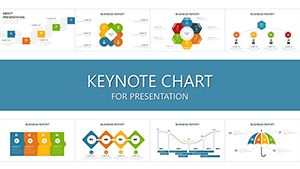
Harness the power of Apple Keynote with our finance chart templates, engineered for seamless integration on macOS. Geared toward data-savvy users like economists, traders, and fiscal policymakers, these charts turn spreadsheets into storytelling masterpieces.
Explore bar graphs for comparative analytics, line charts tracking market volatilities, or scatter plots revealing correlations - all optimized for Keynote`s fluid animations and transitions. With drag-and-drop editing, infuse your data effortlessly, customizing axes, legends, and hues to match corporate themes.
Advantages include native compatibility for lag-free rehearsals, high-fidelity exports for cross-platform sharing, and built-in accessibility features like voiceover support. For finance teams juggling remote collaborations, these templates ensure crisp visuals that drive home projections and forecasts.
Uncover our lineup and infuse your next keynote with precision and flair.
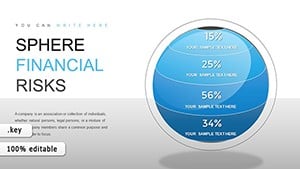


These templates fuel scenarios from startup pitches to regulatory briefings. A candlestick chart variant aids stock traders in demoing trends during client webinars, while donut charts simplify expense breakdowns for nonprofit treasurers.
Consultants in economic forecasting employ area charts to visualize GDP trajectories, captivating international audiences. Even in creative finance roles, like app developers for budgeting tools, bubble charts illustrate user engagement metrics with playful yet precise pops of color.
Keynote`s stock charts, while versatile, lack finance-specific calibrations like logarithmic scales for exponential growth models. Our versions include pre-set formulas for volatility bands and interactive hotspots for drill-downs, surpassing basics in depth. They load 25% faster due to optimized vectors and offer theme syncing across slides.
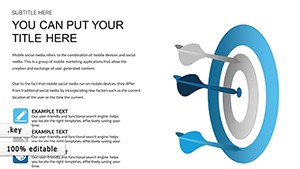
Distinguishing traits: AI-suggested color gradients for data emphasis and export presets for investor decks. Adhere to practices like labeling outliers explicitly and using consistent y-axis breaks to maintain trust in volatile sectors.
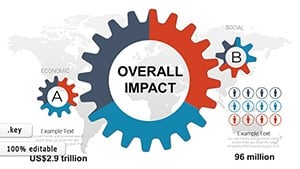
Imagine a central banker unveiling inflation forecasts via animated radar charts, spokes expanding to show regional variances - engaging parliament seamlessly. Or, auditors layering heatmaps over timelines to flag anomalies in transaction logs.
Revitalize your decks - grab a template and animate your insights.
Utilize Keynote`s magic move for fluid chart evolutions between slides. For large datasets, segment into linked sub-charts to avoid overload. Innovate with custom shapes as data vessels, like currency symbols pulsing with values, to infuse personality into staid reports.
These methods craft presentations that not only inform but inspire action in finance forums.
Perfectly, with touch-optimized controls for on-the-go edits.
Yes, granular controls allow sequenced reveals for emphasis.
Vector-based, they adapt flawlessly to any resolution.
Direct paste or table linking updates charts dynamically.
Included, with auto-adjusting contrasts for versatility.
High-res PDF options preserve fidelity for handouts.
Command attention - download and design your finance visuals with ease.
Copyright © 2009-2026 ImagineLayout All rights reserved.