Looking to present complex ideas clearly and efficiently? Our Affinity Diagram Templates for Keynote are designed to help teams and individuals organize concepts, data points, or thoughts into structured visual patterns. Perfect for business planning, workshops, or classroom settings, these templates save time and enhance clarity.
Fully customizable layouts let you add text, icons, and color-coded sections to match your style and presentation goals.
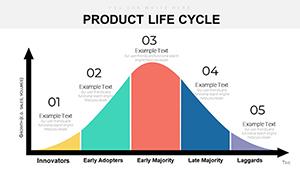
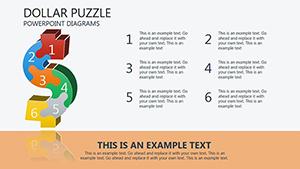
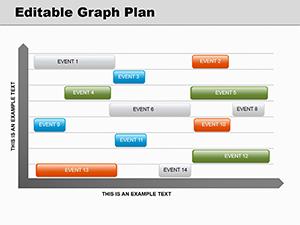
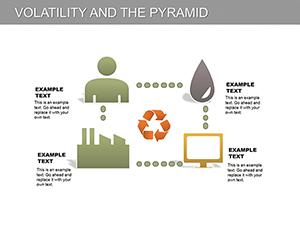
Affinity Diagrams are visual tools that group similar ideas, concepts, or data into categories, making complex information easier to understand and communicate.
Real-World Use Cases
Brainstorming Sessions: Organize team thoughts and creative ideas efficiently.
Problem-Solving Presentations: Present solutions and strategies clearly.
Project Planning: Visualize milestones and track progress.
Data Analysis: Simplify research results or survey trends.
Benefits Over Default Templates
Time-saving pre-designed layouts
Professional appearance and unified style
Easily customizable to suit any presentation
Enhanced clarity for complex information
Creative Tips and Best Practices
Use color-coding to differentiate categories
Combine text and icons for visual appeal
Keep diagrams concise to maintain audience focus
Download your Affinity Diagram Keynote templates today and elevate your presentations with structured clarity and professional design.
Frequently Asked Questions
Can I customize colors and icons in the templates?
Yes, all Keynote Affinity Diagram templates are fully editable allowing you to adjust colors, icons, and text to suit your presentation style.
Are these templates suitable for business and educational use?
Absolutely. They are versatile for business meetings, workshops, classrooms, and project planning sessions.
Do I need advanced Keynote skills to use them?
No advanced skills are required. Templates are ready-to-use with intuitive layouts and simple customization options.
How many templates are included?
The collection includes over 50 professionally designed Keynote Affinity Diagram templates for various use cases.
Can these templates improve presentation clarity?
Yes, by organizing related ideas and data visually, these templates help the audience understand and retain information more effectively.