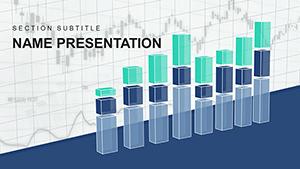
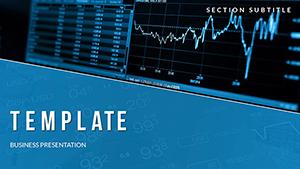
Demystify financial landscapes with our economic indexes PowerPoint templates, essential for analysts, policymakers, and investors tracking GDP, inflation, and stock movements. These slides deliver crisp line graphs, heat maps, and index comparisons that clarify volatility and growth.
PowerPoint-native, they link to Excel for live data pulls and feature forecast projections. Serve boardrooms or classrooms with authoritative designs that build trust through transparency.
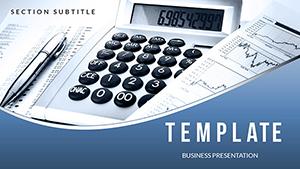
For quarterly reports or investment seminars, precision is key. Index our library and pinpoint your match.
Raw data overwhelms; our templates distill it into scannable visuals with benchmark lines and variance highlights. Dynamic scales auto-adjust for index ranges, outperforming static defaults.
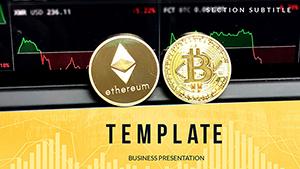
Monetized icons for currencies and sectors add contextual depth.
Strategic Deployments in Finance
Traders forecast with volatility cones. Regulators report compliance via index compliance radars.
Investment Pitches: Sector performance wheels for portfolio diversification.
Policy Briefs: Timeline cascades for historical trends.
Educational Modules: Interactive quizzes on index calculations.
Journalists visualize crises with annotated downturns.
Data-Driven PowerPoint Strategies
Embed pivot tables for drill-downs; animate trend lines for narrative builds. Use conditional colors for bullish/bearish signals.
Expert: Integrate APIs for real-time feeds in advanced setups.
Market-Moving Examples
A hedge fund`s strategy deck influenced allocations, its index overlays spotlighting opportunities. An econ class boosted retention with gamified index trackers.
Extend to global views with currency converters or scenario modelers.
Index your advantage - examine economic templates and download insight.
Frequently Asked Questions
Which indexes are pre-configured?
Dow Jones, S&P, CPI, GDP, with blanks for customs.