Control PowerPoint Charts

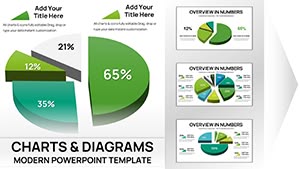
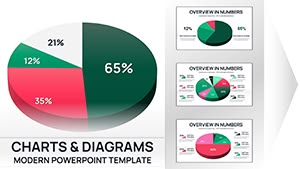
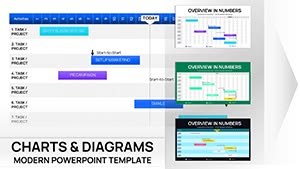
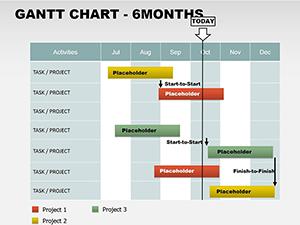
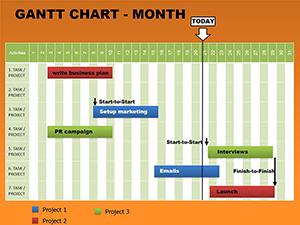
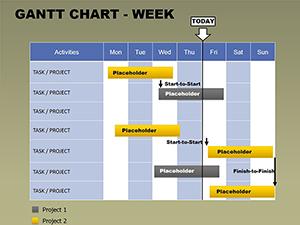
Achieve unwavering project stability with our PowerPoint control chart templates, centered on statistical process control and performance monitoring. These charts plot data against control limits, highlighting anomalies for timely interventions.

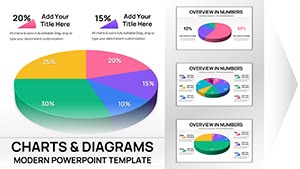
Ideal for quality assurance, operations, and risk management, they include Shewhart, CUSUM, and EWMA variants, all editable in PowerPoint for custom thresholds and annotations. Visualize stability over time to prevent escalations.

Targeted at quality engineers, supervisors, and analysts, these tools democratize advanced charting. Browse to incorporate data vigilance into your oversight routines.


View by: Last Added | Most Popular
  • like 5
    (763)
    Medical Presentations with 3D Visualization DNA PowerPoint Charts
    ID: #PC01053
    $24.00
  • like 4
    (1194)
    Merry Christmas PowerPoint Charts for Presentation
    ID: #PC00895
    $22.00
  • like 2
    (1118)
    Dollars Puzzles 3D PowerPoint Template: Decode Currency Complexities
    ID: #PC00837
    $13.00
  • like 2
    (893)
    Physics Circular Motion Charts PowerPoint Template
    ID: #PC00156
    $22.00
  • like 2
    (1023)
    Collection Pie PowerPoint Charts Template
    ID: #PC00139
    $26.00
  • like 2
    (175)
    Free 6-Month Gantt Chart PowerPoint Template
    ID: #PC00067
    free
  • like 4
    (56)
    Free Monthly Gantt Chart PowerPoint Template
    ID: #PC00066
    free
  • like 3
    (35)
    Free Weekly Gantt Chart PowerPoint Template
    ID: #PC00065
    free
  • like 3
    (439)
    Free Content Overview PowerPoint Charts: Versatile Tools for Dynamic Presentations
    ID: #PC00064
    free
  • like 3
    (785)
    Professional 3D Puzzle Charts PowerPoint Template
    ID: #PC00059
    $17.00
  • like 5
    (669)
    Presentations with Puzzle Pie PowerPoint Chart Template
    ID: #PC00054
    $26.00
  • like 4
    (1026)
    Medical Infographic PowerPoint Charts Template - 37 Editable Slides
    ID: #PC00024
    $22.00
  • like 5
    (565)
    Cyclical Pie Charts PowerPoint Template - Dynamic Viz
    ID: #PC00013
    $20.00


Critical Use Cases for Control Charts

Control charts underpin defect reduction in manufacturing, plotting defect rates to signal shifts. In healthcare, they track patient wait times against benchmarks.

Finance uses them for transaction error monitoring.

  • Process Stability: X-bar charts for mean variations.
  • Attribute Control: P-charts for proportion defects.
  • Trend Analysis: Individuals charts for unique events.

Power rules detect non-random patterns.

Precision Beyond Basic Trend Graphs

Simple line graphs miss control boundaries; ours delineate UCL/LCL with alerts, enabling root-cause analysis. This statistical rigor supports evidence-based adjustments.

Rule-Set Integration

Automated Western Electric rules flag issues.

Implementation Guidelines

Sample appropriately, calculate limits from baseline data, and review periodically. Stratify by subgroups for granularity.

  1. Center lines on targets.
  2. Annotate shifts with causes.
  3. Cap samples at 20-30 points.
  4. Train on interpretation nuances.

Advanced Chart Adaptations

Layer with box plots for distribution insights or integrate with SPC software exports. In dashboards, multi-chart arrays for holistic views.

Frequently Asked Questions

Calculation methods included?

Formulas for sigma limits provided.

Custom limit settings?

Fully adjustable via parameters.

Batch processing?

Macro-enabled for multiple datasets.

Visual alert customizations?

Color and shape options galore.

Historical data import?

CSV/Excel seamless ingestion.

Stabilize your operations. Download control charts for proactive performance management.