Content PowerPoint Charts

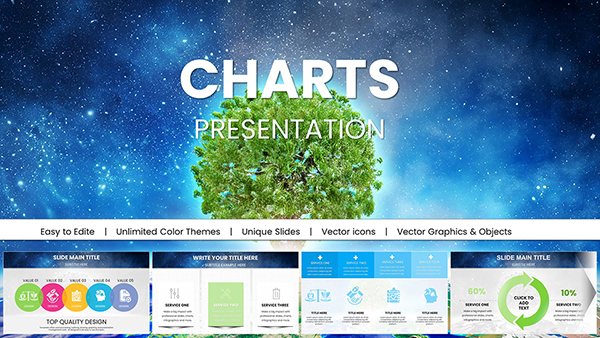
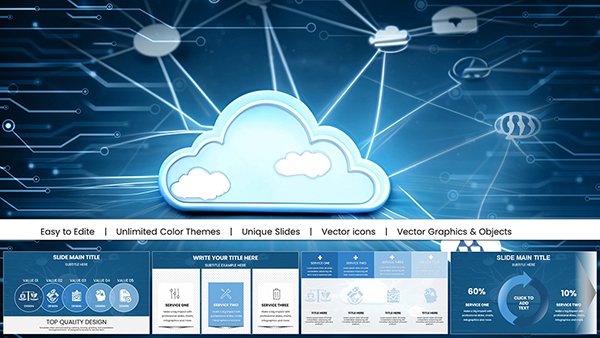
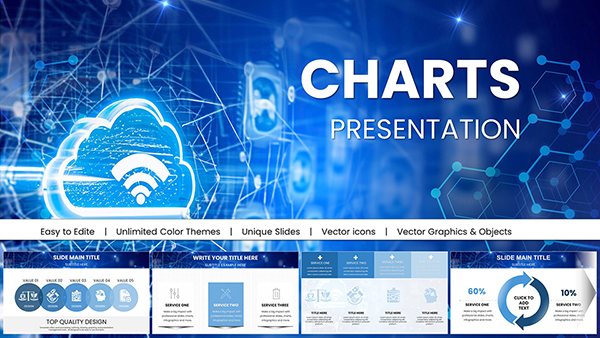
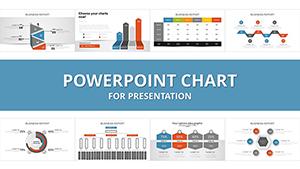
Dive into our extensive range of PowerPoint chart templates, crafted to turn raw data into captivating stories. These pre-designed visuals eliminate the guesswork, allowing you to focus on analysis rather than formatting. Perfect for quarterly reviews, investor updates, or sales forecasts, each template combines precision with aesthetic appeal.

Targeted at data-driven professionals, educators, and marketers, our charts offer scalability, interactive elements, and theme compatibility. Picture a sleek line chart tracking market trends or a clustered column graph comparing performance metrics - all optimized for high-impact delivery.

Key advantages include time savings through drag-and-drop customization, enhanced readability with smart labeling, and versatility across industries. Whether simplifying complex datasets or highlighting key takeaways, these templates make every presentation more persuasive.

Browse the collection now and transform numbers into narratives that drive decisions. With quick downloads and user-friendly edits, professional-grade charts are within reach.


View by: Last Added | Most Popular
  • like 3
    (1177)
    Life Ecology Planet PowerPoint Charts: Visualizing Earth's Vital Systems
    ID: #PC01027
    $20.00
  • like 3
    (19)
    Secure Cloud for Business PowerPoint Charts: Streamlined Data Security
    ID: #PC01024
    $18.00
  • like 4
    (27)
    Network Cloud PowerPoint Charts - Connect Seamlessly
    ID: #PC01023
    $15.00
  • like 5
    (246)
    Interactive PowerPoint Charts Template: Bring Data to Life in Your Presentations
    ID: #PC00923
    $22.00
  • like 5
    (746)
    Circular Economy PowerPoint Charts - Infographic Template
    ID: #PC00908
    $20.00
  • like 5
    (1174)
    Cycles Period PowerPoint Charts Template for Presentation
    ID: #PC00907
    $18.00
  • like 3
    (986)
    Circular Economy Charts: PowerPoint Tools for Sustainable Architecture
    ID: #PC00904
    $15.00
  • like 5
    (1091)
    Safe Period Charts: Your Ultimate PowerPoint Guide to Cycle Awareness
    ID: #PC00903
    $20.00
  • like 4
    (290)
    Project Cycle Steps PowerPoint Charts: Mastering Architecture Management
    ID: #PC00902
    $20.00
  • like 3
    (518)
    Cycles Solutions Infographic: PowerPoint Charts for Architectural Innovation
    ID: #PC00901
    $20.00
  • like 4
    (1167)
    3D Cloud Data Storage PowerPoint Charts Template: Elevate Your Tech Presentations
    ID: #PC00900
    $18.00
  • like 4
    (971)
    Cloud Data Storage PowerPoint Charts Template for Professional Presentations
    ID: #PC00899
    $18.00
  • like 4
    (493)
    Craft Compelling Narratives: Visual Portfolio PowerPoint Charts Template
    ID: #PC00886
    $20.00
  • like 3
    (1015)
    Slideshow Presentation PowerPoint Charts Template
    ID: #PC00875
    $20.00
  • like 2
    (1118)
    Dollars Puzzles 3D PowerPoint Template: Decode Currency Complexities
    ID: #PC00837
    $13.00
  • like 2
    (1086)
    Currency Converter PowerPoint Charts Template - Editable PPT Slides
    ID: #PC00835
    $15.00
  • like 4
    (1174)
    3D Venn PowerPoint Charts Template: Visualize Relationships Dynamically
    ID: #PC00811
    $22.00
  • like 4
    (905)
    Effective 3D Arrow Charts for PowerPoint: 24 Editable Slides
    ID: #PC00805
    $20.00
  • like 4
    (132)
    Dynamic 3D Arrow PowerPoint Charts: 62 Customizable Slides
    ID: #PC00804
    $25.00
  • like 2
    (336)
    Curved Arrow PowerPoint Charts: Dynamic Flow Templates
    ID: #PC00802
    $16.00
  • like 3
    (790)
    5-Step Cycle Arrows PowerPoint Charts Template: Visualize Continuous Flows Effortlessly
    ID: #PC00779
    $18.00
  • like 4
    (246)
    6-Step Cycle Arrows PowerPoint Charts Template: Craft Dynamic Narratives with Ease
    ID: #PC00778
    $18.00
  • like 3
    (546)
    7-Step Cycle Arrows PowerPoint Charts Template: Navigate Success with Precision
    ID: #PC00777
    $18.00
  • like 3
    (428)
    Cycle 8 Arrows PowerPoint Charts Template: Revolutionize Your Visual Storytelling
    ID: #PC00776
    $18.00


Key Use Cases for PowerPoint Chart Templates

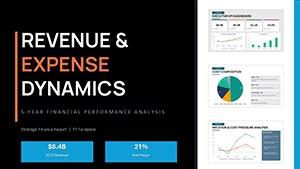
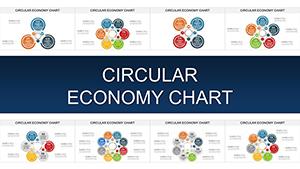
PowerPoint chart templates excel in environments where data clarity is paramount. In corporate finance, waterfall charts break down profit variances, revealing exact contributors to success or shortfall. This precision aids in strategic planning and stakeholder buy-in.

Applications in Education and Research

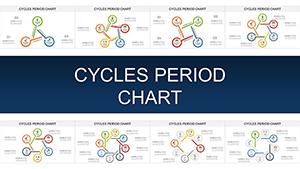
Educators use scatter plot templates to demonstrate correlations, like study hours versus grades, fostering deeper student discussions. Researchers benefit from area charts to visualize survey trends over time, making findings accessible to non-experts.

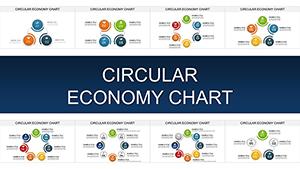
Marketing teams deploy radar charts for competitor analysis, plotting strengths across multiple axes for a 360-degree view. Unlike basic Excel imports, our templates refine these into polished, branded visuals that align with slide aesthetics.

Comparing Our Charts to Built-In Options

Default PowerPoint charts often lack flair, resulting in monotonous bars and lines that fail to engage. Our versions introduce creative twists: 3D effects for depth, gradient fills for emphasis, and icon integrations for thematic relevance. Plus, they handle large datasets without lagging, ensuring smooth rehearsals.

Unique selling points include responsive designs that adapt to widescreen or standard formats, plus embedded formulas for real-time updates. Follow best practices like limiting data series to five for scannability and using contrasting colors to differentiate segments.

Real-World Examples to Get Started

  • Sales Dashboard: A combo chart blending lines for revenue growth and bars for quarterly targets, spotlighting achievements.
  • Survey Breakdown: Donut charts with exploded segments to emphasize top responses in customer feedback decks.
  • Project Timeline: Gantt-style bar charts for milestone tracking, complete with progress indicators.

These examples show how targeted charts amplify messages. Pair them with concise annotations to guide viewers, maintaining a clean 50/50 balance of chart and explanatory text.

Pro Tips for Maximizing Chart Impact

  1. Select the Right Type: Match chart style to data nature - lines for trends, pies for proportions.
  2. Declutter Intentionally: Remove gridlines and legends where possible, letting data breathe.
  3. Incorporate Branding: Apply your logo subtly and match fonts for seamless integration.
  4. Practice Delivery: Rehearse pointing to key data points for live emphasis.

Implementing these elevates mundane reports into strategic tools. Explore our PowerPoint chart templates library and select one to refine your next presentation - downloads are instant and hassle-free.

Frequently Asked Questions

Don`t let data overwhelm - grab a chart template today and craft presentations that inform and inspire.