Comparison PowerPoint Charts

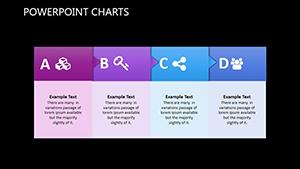
Dive into data disparities with our comparison PowerPoint charts, engineered to juxtapose metrics, trends, and benchmarks in formats that illuminate rather than intimidate. Spider webs, bar duels, and scatter plots await, each primed for your analytical needs.

Financial advisors charting investment returns, HR pros evaluating candidate profiles, or sales teams benchmarking quotas will discover unmatched utility in these charts. Modular elements let you toggle axes or inject formulas, ensuring relevance to evolving datasets.

PowerPoint`s chart engine powers subtle zooms and color shifts, emphasizing variances without verbosity. From conference keynotes to internal dashboards, they adapt to any scale, delivering crisp exports for all platforms.

Contrast to conquer: Check out comparison PowerPoint charts and chart your path to clarity.


View by: Last Added | Most Popular
  • like 4
    (1183)
    Music PowerPoint Charts Template - Harmonize Ideas
    ID: #PC01035
    $18.00
  • like 3
    (46)
    Devices PowerPoint Chart Template: Transform Tech Data into Engaging Visuals
    ID: #PC00888
    $18.00
  • like 4
    (493)
    Craft Compelling Narratives: Visual Portfolio PowerPoint Charts Template
    ID: #PC00886
    $20.00
  • like 3
    (271)
    Dynamic Circumvolution PowerPoint Charts Template: Transform Data into Engaging Narratives
    ID: #PC00700
    $12.00
  • like 3
    (869)
    4-Step Circular PowerPoint Charts Template - Download Presentation
    ID: #PC00690
    $15.00
  • like 4
    (359)
    Decision Support System PowerPoint Charts for IT Analysis
    ID: #PC00428
    $16.00
  • like 5
    (160)
    Change Management PowerPoint Charts: Navigate Transitions with Confidence
    ID: #PC00424
    $18.00
  • like 3
    (666)
    Transfer Credits PowerPoint Charts: Mastering Financial Transitions
    ID: #PC00420
    $18.40
  • like 4
    (982)
    Algorithmic Trading PowerPoint Charts Template: Unlock Market Strategies
    ID: #PC00419
    $17.00
  • like 2
    (908)
    Mobile Apps PowerPoint Charts for Corporate Plans
    ID: #PC00415
    $16.00
  • like 4
    (267)
    Dark Theme Long-Term Planning PowerPoint Charts
    ID: #PC00373
    $18.00
  • like 2
    (136)
    Network Graph PowerPoint Charts Template - Presentation
    ID: #PC00348
    $14.00
  • like 4
    (172)
    Building Bricks PowerPoint Charts Template: Construct Narratives That Last
    ID: #PC00195
    $24.00
  • like 3
    (1125)
    Web Promotion PowerPoint Charts Template
    ID: #PC00183
    $22.00
  • like 3
    (1013)
    Magic Ring PowerPoint Charts Template
    ID: #PC00182
    $15.00
  • like 5
    (783)
    Process Server Circular PowerPoint Charts
    ID: #PC00180
    $22.00
  • like 5
    (1000)
    Magnifying Glass PowerPoint Charts: Zoom into Data Brilliance
    ID: #PC00179
    $24.00
  • like 2
    (604)
    Manufacturing Process and Production Cycle PowerPoint Charts: Optimize Your Workflow Narratives
    ID: #PC00178
    $15.00
  • like 4
    (273)
    Service Financial Analyst PowerPoint Charts Template: Precision in Every Metric
    ID: #PC00177
    $12.00
  • like 3
    (253)
    Related Sequence PowerPoint Charts Template: Connect Ideas with Flow
    ID: #PC00176
    $24.00
  • like 4
    (819)
    Comparison Tours PowerPoint Charts Template: Revolutionize Your Data Storytelling
    ID: #PC00173
    $17.00
  • like 2
    (668)
    Human Body Immune Systems PowerPoint Charts Template: Defend Your Message with Visual Precision
    ID: #PC00171
    $23.00
  • like 5
    (108)
    Hexagon Research Processes PowerPoint Charts: Visualize Complex Ideas Effortlessly
    ID: #PC00169
    $20.00
  • like 2
    (736)
    Analytic Flower PowerPoint Charts Template Presentation
    ID: #PC00125
    $18.00


Use Cases for Comparison PowerPoint Charts

Sales directors harness these charts for quarterly reviews, stacking revenue streams to spotlight underperformers against stars. In real estate, agents diagram property comps, bubble sizes denoting square footage for swift valuations.

Environmental scientists plot climate models, line charts weaving emission scenarios to advocate policy shifts. Fitness apps compare user progress, gauge charts filling with milestone achievements to motivate retention.

Core Applications

  • Analytics: Trend overlaps for forecasting accuracy.
  • Recruiting: Skill matrices for talent matching.
  • Operations: Efficiency bars for process audits.

Why Elevate from Default Charts

PowerPoint`s built-in charts suffice for basics but falter on nuanced contrasts, often muddling scales or ignoring outlier contexts. Ours integrate smart labels that auto-adjust for legibility and conditional formatting to flag thresholds dynamically.

Seamless Excel integration pulls live queries, a boon over manual updates in standards. Enhanced tooltips provide on-hover details, enriching interactivity for digital decks. Cross-platform consistency beats erratic renders in legacy versions.

These charts amplify persuasion, turning raw stats into strategic stories that resonate and retain.

Side-by-Side Specs

FunctionAdvanced ChartsDefaults
ScalingAuto-adaptiveFixed ranges
InteractivityTooltips & drillsBasic hovers
IntegrationLive data linksStatic imports

Best Practices for Chart Comparisons

Anchor with consistent baselines - zero-start axes prevent skewed perceptions. Cluster similar metrics via grouping to ease pattern spotting. Animate sequentially: build baselines first, then variances, guiding viewer logic.

Employ legends sparingly, favoring direct labels for immediacy. Audit for outliers pre-presentation, adding annotations to contextualize anomalies. Leverage themes for brand alignment, ensuring charts echo slide aesthetics.

Key reminder: Always cite sources in footers to bolster trust.

Chart Examples That Convert

A fintech firm boosted conversions 35% by charting loan options in mirrored funnels, flows diverging on rates - the visual funnel drop underscored value. Media outlets dissected election polls with diverging stacked areas, color blocks shifting voter sentiments to engage readers.

Automotive R&D compared engine efficiencies via torque curves, peaks aligning with fuel savings for stakeholder nods. Nutritionists visualized diet impacts, pie slices morphing pre- and post- to illustrate balance shifts.

  1. Threshold Bands: Shade zones for performance alerts.
  2. Dual Axes: Sync for multi-unit insights.
  3. Trend Lines: Overlay for predictive glances.

Quantify your edge: Download a comparison PowerPoint chart and illuminate differences.

Frequently Asked Questions