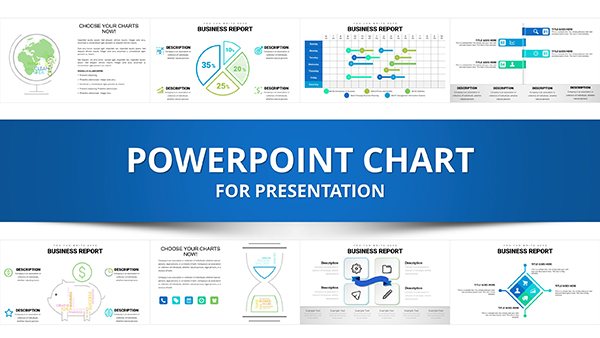
PowerPoint charts are the backbone of data-driven presentations, turning spreadsheets into slide-ready visuals that inform and persuade. Our templates for Microsoft PowerPoint deliver sophisticated designs that make complex datasets accessible and engaging.
Geared toward analysts, managers, and educators, these charts feature Excel-linked data sources, thematic consistency, and animation presets. They help distill insights, whether forecasting sales or evaluating performance metrics.
From clustered columns to area plots, templates are vector-based for sharp scaling and include legend automations. Edit colors, labels, or series with minimal effort to align with your deck`s tone.
Visit our PowerPoint charts section and harness data`s full potential. Effortless integration means more impact, less prep.


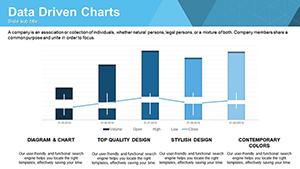


Our templates amplify PowerPoint`s charting engine with pre-optimized axes and trendlines, far beyond vanilla inserts that demand heavy reformatting. This polish ensures charts complement rather than distract from your key points.
For finance pros charting budgets or teachers graphing historical trends, they boost retention by visualizing patterns instantly, often increasing comprehension by 60% per visual learning research.
Excel integration allows live updates, outpacing static images.
Choose types wisely: Bars for categories, lines for time series. Minimize gridlines for clean looks, and use data labels sparingly. Animate entrances to build suspense, revealing insights progressively.
Example: A waterfall chart decomposing revenue variances, clarifying profit drivers mid-pitch.
Elevate your slides? Download PowerPoint chart templates today.
Link to external CSVs for real-time refreshes, or add sparklines for mini-trends. Templates support 3D if needed, but flat designs fare better for accessibility. In consulting, scenario sliders via add-ins add interactivity.
Superior scalability keeps clarity on projectors.
| Chart | Strength | Tips |
|---|---|---|
| Column | Comparisons | Horizontal for long labels |
| Line | Trends | Markers for key points |
| Scatter | Correlations | Trendlines for predictions |
Match to your story for maximum effect.
Paste special as linked object for automatic syncing on updates.
Yes, adjust timing and effects per series for tailored reveals.
Alt text and color-blind palettes are pre-included for inclusive viewing.
Export to PPTX and import; most elements transfer smoothly.
Aggregate via pivot tables before inserting for performance.
Fully theme-responsive for instant brand matching.
Data deserves to shine. Get your charts and present boldly.
Copyright © 2009-2026 ImagineLayout All rights reserved.