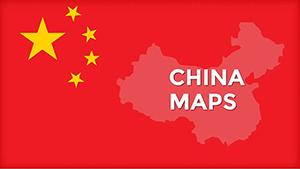
Navigate the vast landscape of China with our specialized PowerPoint map templates, crafted for professionals delivering insights on this dynamic economy. From business strategists mapping supply chains to educators illustrating historical timelines, these templates provide a clear, editable canvas to bring geographical data to life.
Featuring high-resolution outlines of provinces, major cities, and key infrastructure like the Belt and Road Initiative routes, each map is vector-based for effortless scaling and annotation. Customize colors to highlight economic hotspots or population densities, making complex information digestible and engaging for any audience.
Whether preparing for a corporate boardroom pitch or a classroom lecture, these templates ensure your presentations stand out with accuracy and visual appeal. Say goodbye to static images and hello to interactive storytelling that captivates and informs.
Dive into our collection today and transform raw data into compelling narratives. Select, edit, and present with confidence!


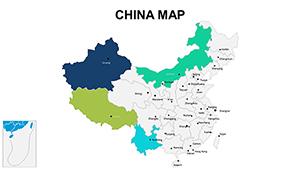
China`s influence spans global trade, technology, and culture, demanding precise visual aids in presentations. Our PowerPoint map templates surpass basic clipart by offering layered designs where users can isolate regions like Guangdong for focused analysis or overlay trade statistics across the entire nation. This granularity allows for tailored storytelling, whether discussing urban migration or agricultural yields.
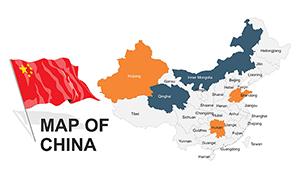
In contrast to free online maps that often lack editability, our templates integrate seamlessly with PowerPoint`s animation tools, enabling phased reveals of data layers for dramatic effect. Professionals in international relations, for example, praise the inclusion of disputed territories with neutral styling to maintain diplomatic tones.
Best practices include using consistent color schemes - greens for fertile areas, reds for industrial zones - to reinforce thematic consistency. A case in point: A logistics firm utilized our template to map shipping routes, cutting presentation prep time by 40% and securing a major contract through clearer visualizations.
Beyond basic outlines, templates include infographic icons for ports, airports, and high-speed rail lines, ready for data-driven pop-ups. Ensure mobile compatibility by testing animations on various devices, and leverage PowerPoint`s morph transition for smooth zooms from national to regional views.
What sets our templates apart is their focus on user empowerment - tools that adapt to your narrative, not the other way around. Explore the variety and download to elevate your next presentation.
Yes, every element is vector-based, allowing resizing, recoloring, and text additions without quality loss.
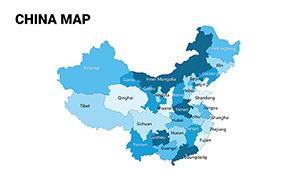
Absolutely, with labeled options for all 31 provinces, autonomous regions, and over 50 key cities like Beijing and Shanghai.
Yes, licensed for commercial use, perfect for boardrooms, conferences, and client pitches.
High-resolution vectors ensure clarity on 4K displays and printed materials alike.
Use PowerPoint`s built-in entrance effects or group layers for custom sequences like region-by-region reveals.
Yes, specialized variants cover Belt and Road, economic zones, and environmental data overlays.
Chart your course with precision - select a China map template and bring your data to the forefront in your next presentation.
Copyright © 2009-2026 ImagineLayout All rights reserved.