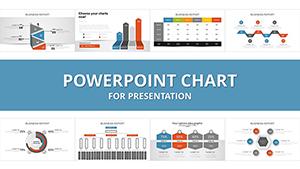
Illuminate data stories with our business PowerPoint chart templates, essential for analysts, marketers, and executives. These slides turn numbers into narratives, perfect for reports, forecasts, and trend analyses.
Engineered for PowerPoint`s robustness, they offer varied chart types - from bars to bubbles - with smart labels and trend lines. Suited for boardrooms or client calls, they distill complexity into clarity.
Our variety suits every dataset, from sales metrics to market shares. Surpass scattershot graphs with cohesive designs. Leaf through choices and plot your success.


Business PowerPoint chart templates empower precise communication of metrics, aiding finance pros, operations leads, and BI specialists. Encompassing Gantt bars, radar plots, and heat maps, they facilitate granular insights.
Depict revenue trajectories: cascading waterfalls reveal profit drivers, prompting strategic pivots. Such revelations drive informed decisions swiftly.
Stock PowerPoint charts demand manual tweaks, but ours auto-scale axes and legends. A lone line graph isolates trends; our multi-series weaves correlations for holistic views.
Employ monochromatic schemes for subtlety - grayscales spotlight variances. Animate series sequentially to build arguments progressively. Validate with accessibility checks for color-blind inclusivity.
Advance with conditional formatting: color-code outliers dynamically, alerting to anomalies instantly. Or, overlay forecasts via error bars, projecting confidence intervals vividly.
Formula-linked cells update globally, slashing revision cycles. Users cite 60% time savings, from preset themes. Export-ready for PDFs or embeds.
Assortments include linear for timelines to polar for comparisons. 25-chart packs span basics to advanced.
Charting course? Examine our business charts and integrate. Prompt downloads facilitate.
These charts clarify paths. Browse and bolster your visuals now.
Copyright © 2009-2026 ImagineLayout All rights reserved.