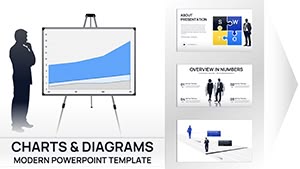
Bring data to life in your Keynote presentations using our specialized chart templates for business ideas. These visuals distill analytics into stories that inform and persuade, perfect for strategy sessions and reports.
Designed for analysts and leaders, the templates offer diverse chart types with embedded formulas for dynamic updates. Effortlessly adjust scales, add trendlines, and sync with your data sources for real-time relevance.
From candlestick charts for financial overviews to combo charts blending metrics, each piece enhances decision-making. Maintain audience attention with vibrant yet professional aesthetics.
Chart your course to success - dive into our Keynote chart templates and download assets that amplify your ideas today.
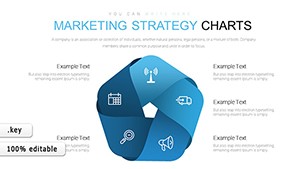
Keynote charts in our library harness the app`s rendering power for fluid interactions, like pinch-to-zoom on mobiles. They surpass basics with layered data series and conditional formatting for nuanced views.
Address data overload by prioritizing scannable layouts, complete with tooltips for details on hover.
Empower insights with these innovations.
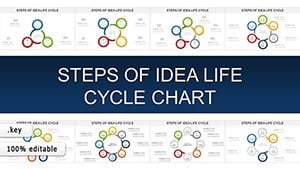
Strategy maps use Sankey diagrams to flow resources to outcomes. Performance dashboards employ gauge charts for KPI monitoring.
Forecasting sessions feature exponential curve charts for growth projections. Compliance reports utilize compliance bar charts for audit trails.
Charts clarify paths to objectives.
Default charts lack thematic cohesion; ours bundle with business palettes and legends. Manual data entry plagues basics - our templates support import wizards.
| Factor | Standard | Ours |
|---|---|---|
| Data Import | Manual | Automated |
| Theme Matching | Limited | Extensive |
| Interactivity | Basic | Rich |
Advanced options yield superior analytics.
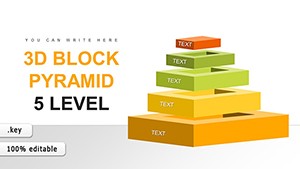
Match chart to metric: columns for discrete, lines for continuous. Cap axes at meaningful ranges, and annotate peaks/valleys. Use builds for layered reveals.
Incorporate scenario sliders for what-if analyses. For global strategies, multi-language labels.
Visualize victory - download charts now for strategic edge.
Copyright © 2009-2026 ImagineLayout All rights reserved.