Business processes PowerPoint Charts

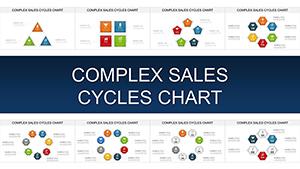
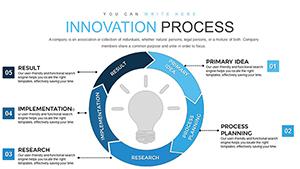
Navigate the complexities of operations with our business process chart templates for PowerPoint. These comprehensive designs map out workflows, from ideation to execution, using intuitive charts that highlight efficiencies and pain points. Geared toward executives, consultants, and team leads, they simplify strategy sessions and performance reviews with precision visuals.

Benefit from drag-and-drop compatibility, color-coded stages, and scalable icons that adapt to your branding. Replace convoluted spreadsheets with charts that foster understanding and drive decisions, ensuring every stakeholder grasps the big picture.

Delve into our assortment and select charts that align with your goals. Download immediately to integrate into your workflow today.


View by: Last Added | Most Popular
  • like 2
    (543)
    Pro Plumbing Flow PowerPoint Charts Template
    ID: #PC01059
    $18.00
  • like 3
    (1190)
    Burning Discounts PowerPoint Charts Template
    ID: #PC01043
    $20.00
  • like 3
    (356)
    Food Pyramid PowerPoint Charts for Nutrition
    ID: #PC00989
    $18.00
  • like 4
    (1191)
    Security PowerPoint Charts: Key Access Templates
    ID: #PC00983
    $18.00
  • like 2
    (253)
    Brain Five Senses PowerPoint Infographics Template
    ID: #PC00948
    $18.00
  • like 3
    (207)
    Master Complex Sales Cycles with Stunning PowerPoint Charts
    ID: #PC00909
    $18.00
  • like 5
    (1174)
    Cycles Period PowerPoint Charts Template for Presentation
    ID: #PC00907
    $18.00
  • like 5
    (453)
    Step Solutions PowerPoint Charts: Master Problem-Solving Presentations
    ID: #PC00905
    $20.00
  • like 3
    (625)
    Pyramid Ring PowerPoint Charts Template
    ID: #PC00847
    $18.00
  • like 5
    (571)
    Porter's Five Forces PowerPoint Template: Strategic Analysis for Architects
    ID: #PC00825
    $15.00
  • like 5
    (88)
    Activity-Based Costing Arrow PowerPoint Charts Template for Presentation
    ID: #PC00823
    $17.00
  • like 3
    (624)
    Sales Funnel Analytics PowerPoint Charts Template
    ID: #PC00818
    $18.00
  • like 4
    (309)
    Pyramid Scheme PowerPoint Template: Empower Awareness and Prevention
    ID: #PC00816
    $18.00
  • like 2
    (794)
    Puzzles for Analytics Interviews PowerPoint Charts Template
    ID: #PC00812
    $20.00
  • like 4
    (960)
    Steps Processing PowerPoint Charts Presentation Template
    ID: #PC00809
    $20.00
  • like 5
    (1169)
    MYP Technology PowerPoint Charts Template
    ID: #PC00813
    $20.00
  • like 4
    (528)
    3D Cubes Porter's Five Forces PowerPoint Template
    ID: #PC00806
    $15.00
  • like 2
    (42)
    3D Funnel PowerPoint Charts Template: Visualize Processes
    ID: #PC00803
    $20.00
  • like 4
    (633)
    Innovation Process Steps PowerPoint Charts: From Idea to Implementation
    ID: #PC00798
    $18.00
  • like 3
    (1158)
    Method SWOT Analysis PowerPoint Charts Template for Strategy
    ID: #PC00752
    $24.00
  • like 4
    (1023)
    Ishikawa Cause-Effect PowerPoint Charts Template: Decode Problems Visually
    ID: #PC00733
    $18.00
  • like 2
    (733)
    Best Action Plan Steps PowerPoint Template for Project Success
    ID: #PC00723
    $15.00
  • like 5
    (752)
    Effective Problem Solving with PowerPoint Charts - Download Template
    ID: #PC00702
    $23.00
  • like 4
    (494)
    4 Steps Square PowerPoint Charts Template - Presentation
    ID: #PC00686
    $12.00


Empowering Decisions with Process Charts

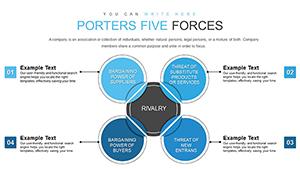
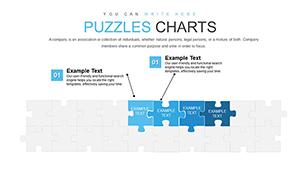
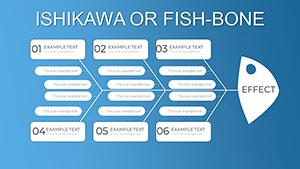
Business process charts distill intricate operations into digestible diagrams, revealing bottlenecks and opportunities at a glance. They surpass basic flow diagrams by incorporating metrics overlays, ideal for audits in manufacturing or service delivery.

Targeted Scenarios for Organizational Growth

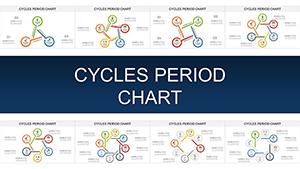
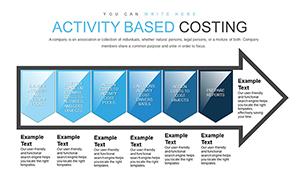
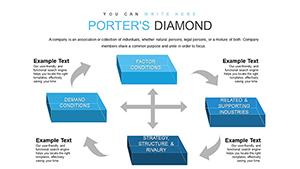
  • Operations Management: Chart supply chain stages with throughput indicators.
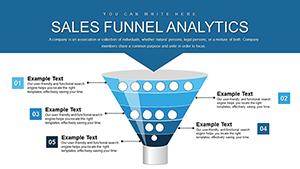
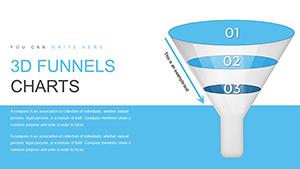
  • HR Onboarding: Visualize recruitment funnels for talent acquisition teams.
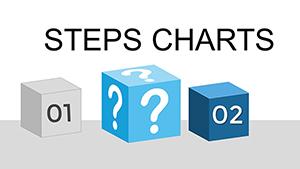
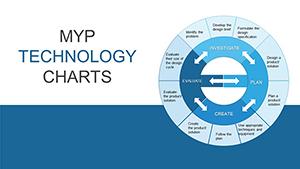
  • IT Transformations: Map agile sprints in software development pipelines.

Outshining native PowerPoint shapes, these templates feature auto-alignment and validation checks, preventing common mapping errors.

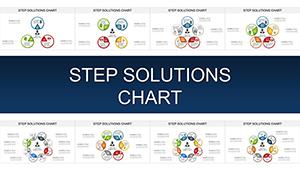
Core Advantages of Our Chart Library

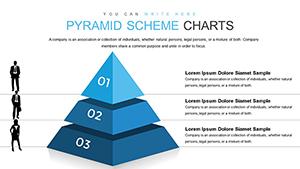
Highlights include modular nodes for easy reconfiguration and embedded formulas for real-time updates. Best practices: Start with high-level overviews, then drill down, using swimlanes for cross-departmental clarity in enterprise reviews.

Envision a merger integration: charts evolve from chaos to synergy, guiding post-deal harmonization with phased visuals.

Practical Strategies for Implementation

  1. Layer conditional formatting to flag delays, automating alerts in shared decks.
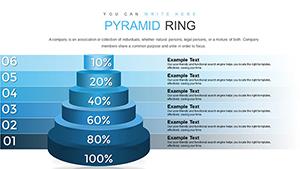
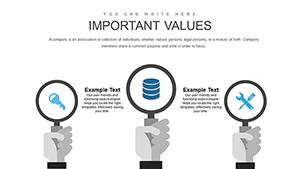
  2. Combine with KPIs for holistic dashboards in executive summaries.
  3. Export to PDF for stakeholder handouts without losing fidelity.

Optimize your processes - explore business charts and download essentials.

Integrating Processes with Team Dynamics

These charts promote accountability by assigning visual ownership, enhancing collaboration in remote setups.

Measuring Impact

Track adoption through before-after comparisons, quantifying efficiency gains.

Frequently Asked Questions

Refine your operations - grab your chart template today.