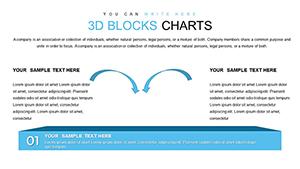
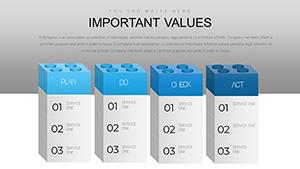
Assemble clarity with block PowerPoint chart templates, perfect for structuring hierarchies and comparisons in a snap. Directed at architects, planners, and analysts, these templates use modular blocks to segment and spotlight critical components.
From stacked comparisons to grid layouts, they provide sturdy frameworks that withstand data density, ensuring hierarchies emerge naturally. Ideal for org charts or resource allocations, they ground abstract ideas in tangible forms.
Native to PowerPoint, with snap-to-grid precision and bulk edits. Suited for planning decks, reviews, or overviews, they fortify your message`s architecture.
Enter our block charts category and stack a template suited to your build. Erect presentations that stand strong and speak clearly.
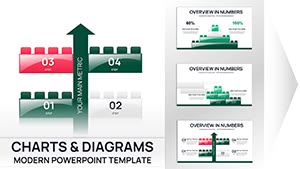
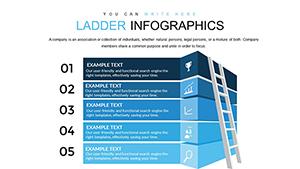
Construction Company PowerPoint Charts Template: Download Presentation
ID: #PC00526
$21.00
(708)
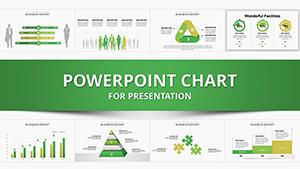
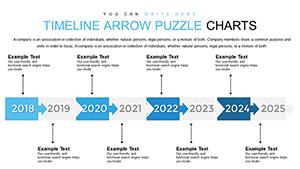
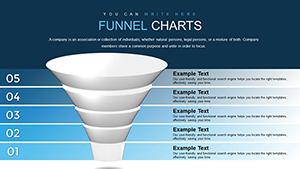
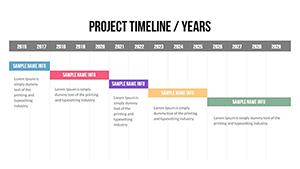
Project Timeline PowerPoint Charts Templates
ID: #PC00500
$20.00
(960)
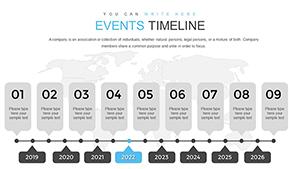
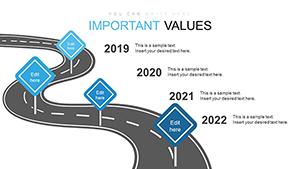
Dynamic Company Timeline PowerPoint Charts Template
ID: #PC00498
$20.00
(400)
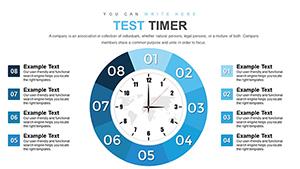
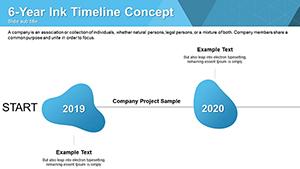
Timeline Maker PowerPoint Charts Template
ID: #PC00497
$21.00
(831)
Analytical Reviews PowerPoint Charts Template
ID: #PC00349
$17.00
Excellence in Block PowerPoint Charts
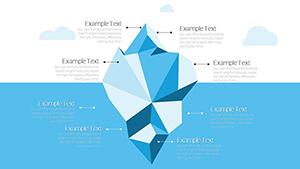
These block charts master modularity, with interlocking pieces that expand or contract fluidly, outdoing scattered boxes with cohesive grids. They shine in layered info, preserving order amid complexity.
Perks: Shadow depths for dimension, alignment aids for perfection.