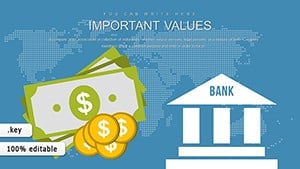
Capture the essence of financial data with our bank account Keynote chart templates. Geared toward analysts and presenters, these tools offer sophisticated visuals for balances, inflows, and outlays. Make your Keynote decks stand out with charts that inform and persuade.
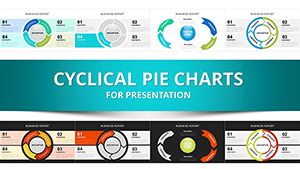
From treemaps for portfolio breakdowns to combo charts for trend analysis, our templates are vector-based for scalability and include data labels in financial terms. Edit effortlessly to reflect your latest figures.
Scan our options and infuse your presentations with clarity. Download to chart success in your financial discussions.


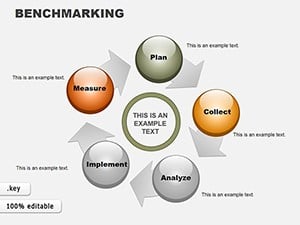
Charts in Keynote amplify data`s story, and our bank account-focused ones excel here. Use in risk assessments with bubble charts or performance dashboards with gauges.
Outshining stock charts, ours have thematic consistency and export-ready formats, cutting production time significantly.
Choose scales wisely - linear for steady growth, log for exponential. Add legends with tooltips for interactivity.
Unique idea: Animate a "Transaction Cascade" chart to simulate daily flows, engaging viewers dynamically.
Support for 3D effects and shadows for depth, plus color-blind friendly palettes. Traders value their precision in volatile markets.
Sync with Numbers app for updates. Pick one and visualize victory.
Validate data sources pre-presentation.
Bring data to life - download your chart template today.
Copyright © 2009-2026 ImagineLayout All rights reserved.