Background Keynote Charts

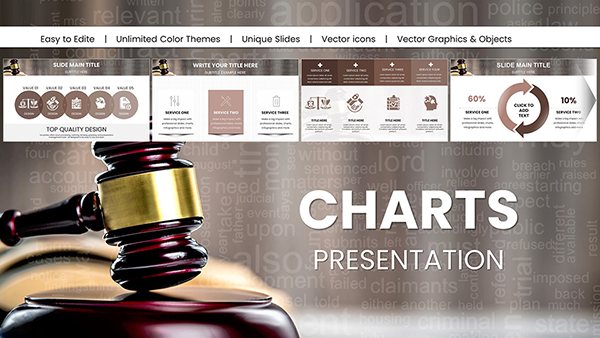
Infuse your Keynote charts with purpose-built background templates that amplify data without stealing the spotlight. Crafted for analysts, marketers, and speakers, these designs incorporate grid alignments, metric-inspired patterns, and neutral palettes to underscore trends and figures effectively.

Ideal for quarterly reviews or research overviews, they turn raw numbers into compelling stories. Customize scales, integrate legends, or blend with color-coded bars - all within Keynote`s intuitive interface. Gain confidence in presenting insights that drive decisions.

Peruse our assortment to find the backdrop that best supports your data narrative. Get started with a download and watch your charts transform.


View by: Last Added | Most Popular
  • like 5
    (13)
    Drone IT Technology Charts Keynote Template: Elevate Tech Innovations Visually
    ID: #KC01052
    $25.00
  • like 5
    (11)
    Medical Charts Keynote Template - Editable Healthcare Infographics
    ID: #KC01045
    $20.00
  • like 5
    (11)
    Futuristic Mask Charts Keynote Template
    ID: #KC01042
    $18.00
  • like 4
    (13)
    Medical Science Charts Template for Keynote Presentation
    ID: #KC01040
    $20.00
  • like 5
    (15)
    Marketing Charts Template for Keynote: Editable and Professional
    ID: #KC01038
    $20.00
  • like 5
    (16)
    Customizable Legal Charts Keynote Template: Clarify Complex Cases with Ease
    ID: #KC01033
    $25.00
  • like 4
    (579)
    Creative Marketing Ideas for Stunning Keynote Presentations
    ID: #KC01022
    $15.00
  • like 4
    (1081)
    Extraction Oil and Gas Company Keynote Charts: Strategic Energy Insights
    ID: #KC01007
    $22.00
  • like 4
    (791)
    Oil Price Keynote Charts: Forecast Energy Markets
    ID: #KC00999
    $18.00
  • like 4
    (522)
    Design Automatic Tonometer Keynote Charts Template: Illuminate Eye Health Data
    ID: #KC00978
    $18.00
  • like 3
    (445)
    Pill Pharmaceutical Medical Keynote Charts Template: Master Drug Data Storytelling
    ID: #KC00977
    $18.00
  • like 4
    (922)
    Geothermal Energy Charts for Keynote: Illuminate Renewable Insights
    ID: #KC00969
    $20.00
  • like 5
    (1026)
    Education-Focused Keynote Charts Pack: Spark Learning with Visuals
    ID: #KC00968
    $20.00
  • like 3
    (607)
    4Cs & 7Ps Marketing Mix Keynote Charts Template
    ID: #KC00833
    $15.00
  • like 4
    (415)
    2D Puzzles Keynote Charts Template: Engage with Interactive Visuals
    ID: #KC00817
    $18.00
  • like 4
    (739)
    Cause and Effect Tree Keynote Charts
    ID: #KC00800
    $24.00
  • like 5
    (365)
    Margin Keynote Charts: Unlock Profitability Insights
    ID: #KC00770
    $22.00
  • like 3
    (525)
    Marketing Mix Keynote Charts Template
    ID: #KC00754
    $24.00
  • like 5
    (980)
    6-Level 3D Block Pyramid Keynote Charts
    ID: #KC00744
    $23.00
  • like 5
    (730)
    SEO Infographic Keynote Charts Template: Transform Data into Actionable Insights
    ID: #KC00735
    $15.00
  • like 3
    (3)
    Fishbone: Ishikawa Cause-Effect Keynote Charts Template
    ID: #KC00733
    $18.00
  • like 4
    (1198)
    Time Management Keynote Charts for Marketers: Optimize Your Workflow
    ID: #KC00720
    $16.00
  • like 5
    (938)
    Protection, Economy, Market: Keynote Charts for Economic Insights
    ID: #KC00696
    $24.00
  • like 2
    (1047)
    Creative Economy Graph Keynote Charts Template: Elevate Your Data Storytelling
    ID: #KC00687
    $18.00


Enhancing Keynote Charts with Strategic Backgrounds

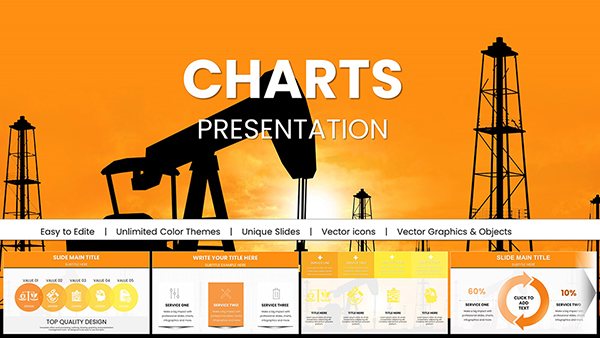
Chart backgrounds in Keynote establish a foundation for data interpretation, subtly reinforcing scales and axes. Finance pros benefit from ledger-like textures that evoke precision, while marketers favor wave patterns for growth trajectories. Superior to generic fills, these templates ensure pixel-perfect alignment and thematic cohesion across slides.

Benefits encompass quick application and variant packs for A/B testing visuals. Practice tip: Limit to two accent colors per chart, anchor data points visually, and use faint grids for readability.

  • Financial Reports: Subdued checkers for balance sheets.
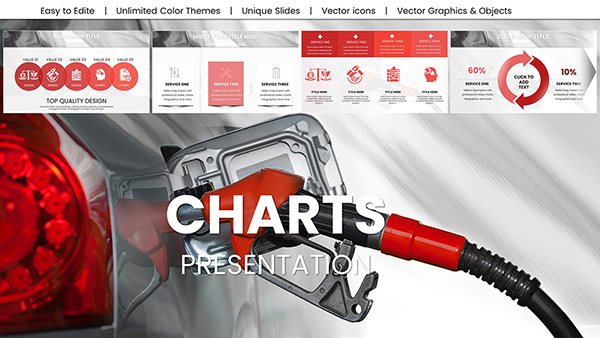
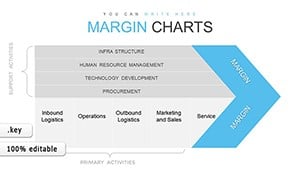
  • Marketing Analytics: Arrow motifs for conversion paths.
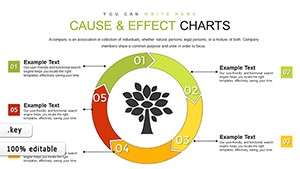
  • Health Metrics: Pulse lines for trend tracking.

Versatile Applications and Examples

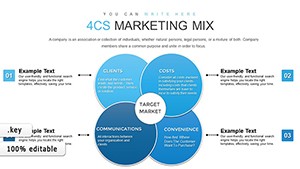
At a product launch, a bar-chart backdrop with rising motifs mirrors sales spikes, engaging stakeholders. Academic posters use fractal patterns for scientific distributions, adding intrigue. Over 45 templates await, including seasonal data themes. Fuse with pie charts for multi-view insights.

Distinctive edge: Responsive to data updates, backgrounds auto-adjust. Idea: Embed hyperlinks in chart elements over patterned backs for interactive decks.

Fostering Data Storytelling

Adapt to audience expertise - detailed for peers, simplified for executives. Validate with color-blind simulators.

Pro Techniques for Chart Backgrounds

Apply via slide master for uniformity. Blend modes create depth illusions. Sync with theme fonts for polish.

  1. Scale backgrounds to chart bounds.
  2. Test legibility at 10% zoom.
  3. Archive variants for future decks.

Empower your presentations - choose and customize today.

Frequently Asked Questions