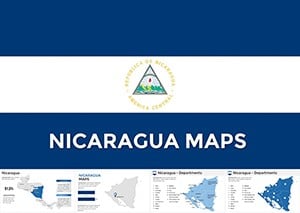
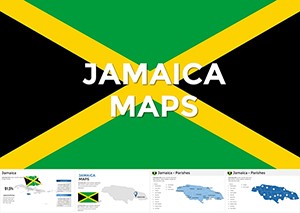
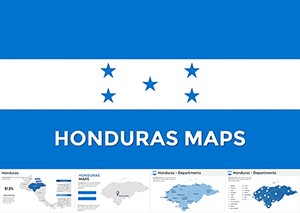
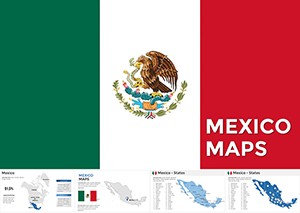
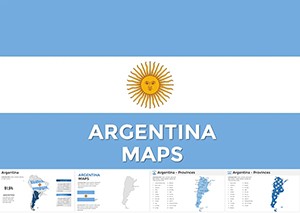
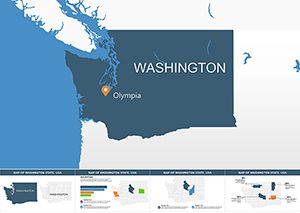
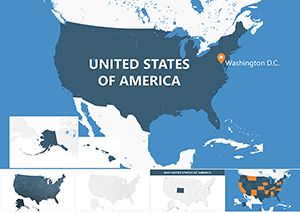
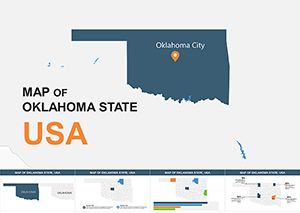
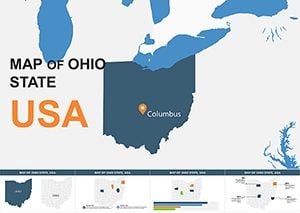
Present geographic data with confidence using America Keynote map templates designed for clarity accuracy and strong visual impact. This collection helps you explain markets regions growth and logistics without clutter or confusion.
Each slide is fully editable in Keynote so you can highlight states regions routes or coverage areas in seconds. Use these maps to turn raw location data into a story your audience instantly understands.
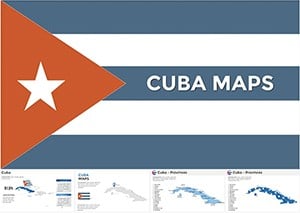
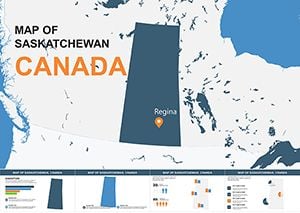
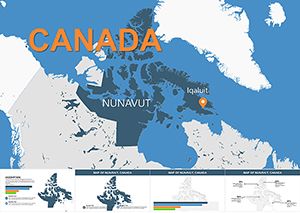
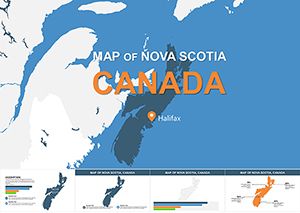
Nova Scotia Keynote Maps: Editable Presentation Tool
ID: #KM00132
$10.00
Why Use America Keynote Map Templates
Maps are one of the fastest ways to communicate scale reach and regional insight. Default presentation maps often look generic and lack flexibility. These templates are built to solve that problem with clean layouts precise shapes and presentation ready styling.
Editable vector shapes for every region
Consistent colors and typography
Slides optimized for large screens
Real World Use Cases
Business and Corporate Reports
Show sales territories expansion plans supply chains and regional performance in a clear professional format. Executives can instantly see where growth happens.
Marketing and Strategy Presentations
Visualize target markets campaign coverage and audience distribution across America. Maps make strategies feel concrete and actionable.
Education and Training
Support lessons with clean geographic visuals that keep attention and improve understanding during lectures or online courses.
Benefits Compared to Default Slides
Unlike basic built in slides these templates give you control. You can recolor regions add labels emphasize trends and adapt slides to your brand without design skills.
Faster slide creation
More professional appearance
Better audience engagement
Creative Tips for Better Map Slides
Focus on one message per slide. Use contrast to highlight key regions and keep labels minimal. Pair maps with short insights rather than long text blocks.
Ready to upgrade your presentation visuals. Choose a template and start building clearer stories today.
Frequently Asked Questions
Are these Keynote map templates fully editable
Yes all shapes colors and text can be customized directly in Keynote.
Can I use these templates for commercial projects
Yes they are suitable for client work internal reports and public presentations.
Do these slides work on large screens
Yes layouts are optimized for conferences meetings and projections.