Bring energy to your planning with our activity chart PowerPoint templates, crafted to visualize progress, participation, and outcomes in dynamic ways. Targeted at event coordinators, teachers, and team leads, these designs turn routine tracking into engaging experiences.
From progress bars for team-building exercises to radial charts for event feedback, each template simplifies data while sparking interest. Their playful yet professional aesthetics ensure versatility across casual and formal settings. Customize with ease to reflect your group`s vibe, saving effort and amplifying impact.
This category is your hub for charts that motivate and measure. Start exploring to find tools that make every activity shine.


Activity charts in PowerPoint should inspire action, not bore - our templates achieve this by merging fun motifs with robust data handling, outshining bland defaults that fail to engage.
They streamline what generic charts complicate, focusing on user interaction over complexity.
Educators use bubble charts to map student involvement in group projects, highlighting collaboration patterns. Corporate trainers apply waterfall diagrams to dissect workshop ROI, linking efforts to results.
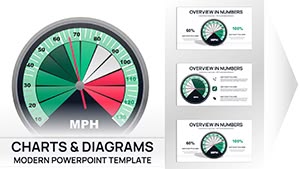
Planners track attendance with heat maps, identifying peak engagement zones. Recreation leaders employ gauge charts for fitness challenges, gamifying progress to sustain motivation.
Organizers visualize volunteer hours via stacked bars, celebrating contributions. Community groups leverage donut charts for survey results, guiding future initiatives.
Insight: Animate data entry to mimic activity flow, enhancing narrative rhythm.
Excelling in interactivity, these templates support click-to-drill features, revealing sub-data on demand. Eco-friendly color choices promote accessibility.
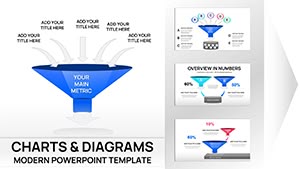
Scenario: A youth camp director displays adventure completions with progress radars, rallying campers for finales. Or, in corporate retreats, funnel charts trace team dynamics, informing bonding tweaks.
Boost participation and insights alike.
Browse to select charts that energize your activities. Seamless downloads await. Get started today and chart paths to greater involvement.
Copyright © 2009-2026 ImagineLayout All rights reserved.