Inject fun into your Keynote decks with charts designed for activities, from team-building exercises to classroom polls. These include progress trackers, scoreboards, and feedback loops, fostering interaction at every turn.
Teachers, trainers, and facilitators find them invaluable for dynamic sessions, where visuals encourage input and reflection. With simple tweaks, adapt to group sizes or themes, turning passive viewing into active involvement.
Watch engagement soar as participants connect with content through playful yet purposeful designs. Make every activity count.
Activate ideas: Check out these Keynote charts and launch your next interactive adventure.
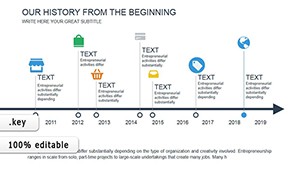
Bring History to Life: History Timeline Keynote Charts Template
ID: #KC00453
$12.00
(1020)
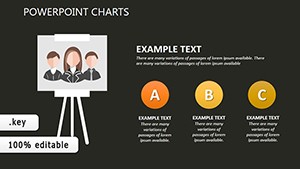
HR Analytics Charts Keynote Template
ID: #KC00381
$20.00
(53)
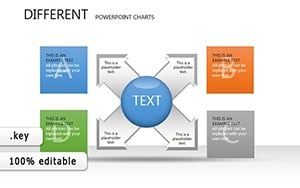
Different Keynote Charts: Decode Marketing Dynamics with Diverse Visuals
ID: #KC00253
$24.00
(284)
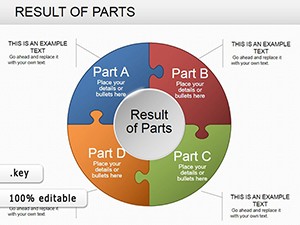
Pie Data Keynote Charts: Master Data Visualization with Precision
ID: #KC00236
$20.00
(363)
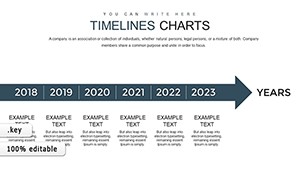
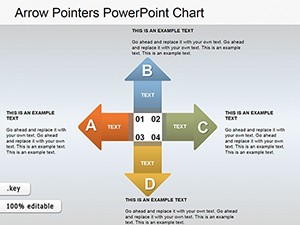
Arrow Pointers Keynote Charts: Direct Your Audience with Precision
ID: #KC00158
$18.99
(747)
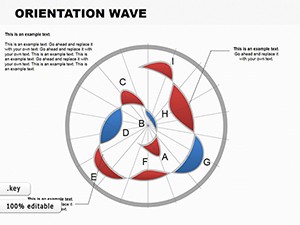
Orientation Wave Keynote Charts: Surf the Flow of Your Ideas
ID: #KC00103
$10.00
(309)
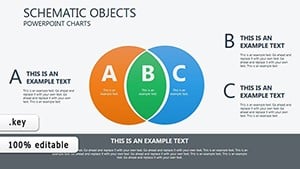
Venn Diagram Keynote Charts - Fully Editable
ID: #KC00098
$13.00
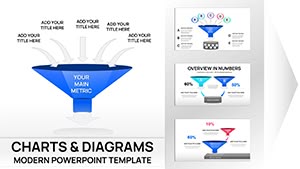
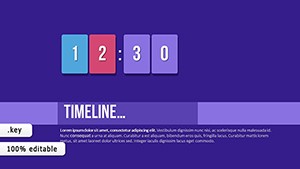
Dynamic Charts for Activity-Driven Presentations
Activities Keynote charts revolutionize group dynamics, with elements like voting bars and milestone rings that invite real-time updates. They transcend standard visuals by embedding prompts for audience contributions.
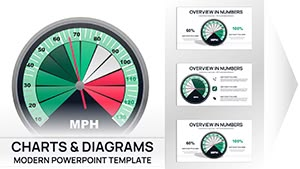
In corporate training, they map skill-building paths, where radial dials gauge confidence levels pre- and post-exercise. Impact: Sessions that energize and educate simultaneously.