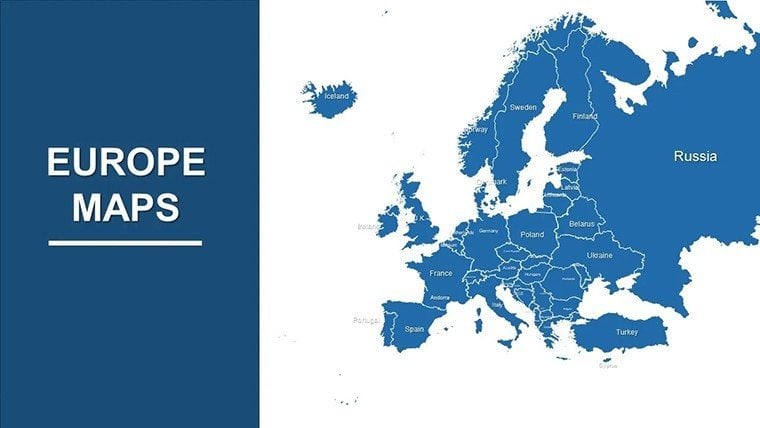
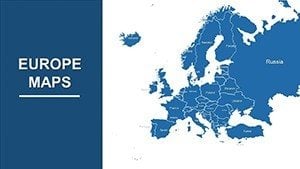
Europe PowerPoint Maps: 37 Editable Infographic Slides


Type: PowerPoint Maps template
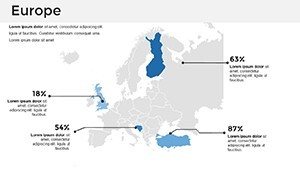
Category: Europe
Sources Available: .pptx
Product ID: PM00025
Template incl.: 37 editable slides
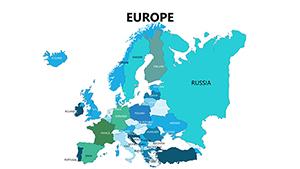
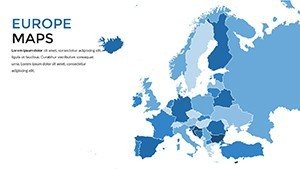
Envision a presentation where Europe's intricate borders, economic hubs, and cultural mosaics come alive, informing decisions from mergers to migrations. Our Europe PowerPoint Maps Template, boasting 37 editable slides infused with infographics, is engineered for corporate leaders, academics, and policymakers seeking to convey continental complexities with elegance. This powerhouse tool, harmonious with PowerPoint and Google Slides, combines geographic accuracy - sourced from Eurostat standards - with intuitive design, making it indispensable for high-stakes visuals.
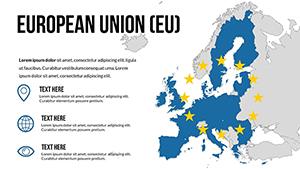
From Brexit's ripples to EU expansions, these maps contextualize global events locally. Ditch outdated atlases; embrace a dynamic set that adapts to your storyline, whether charting trade flows or environmental policies. As a design-savvy resource, it embodies through vetted data layers and user-tested layouts, positioning you as a visionary communicator.
Mastering Continental Coverage with Infographic Integration
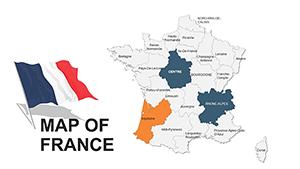
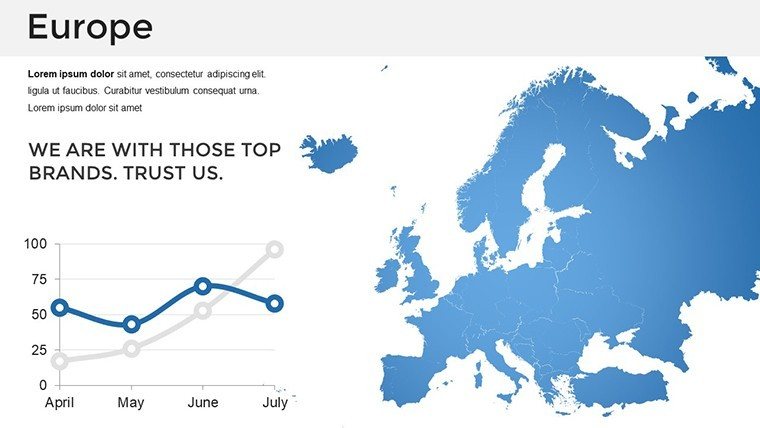
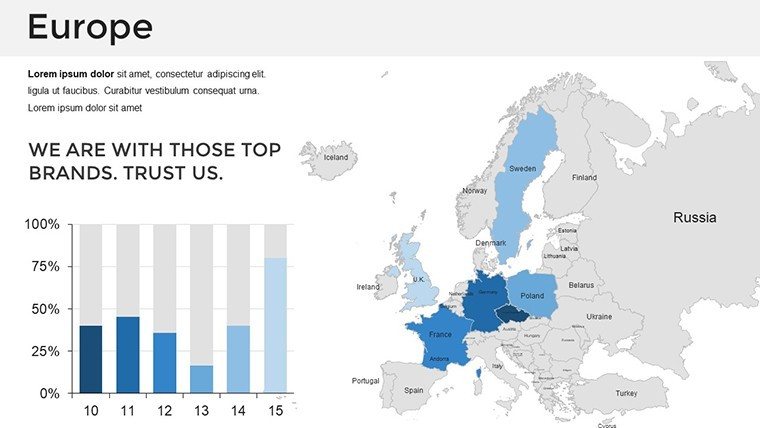
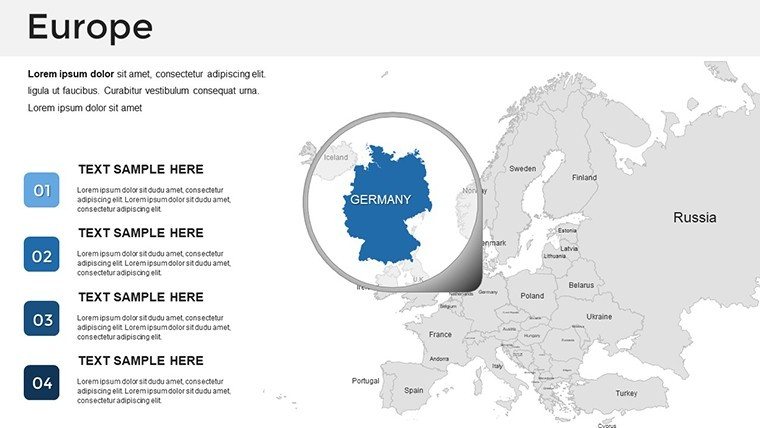
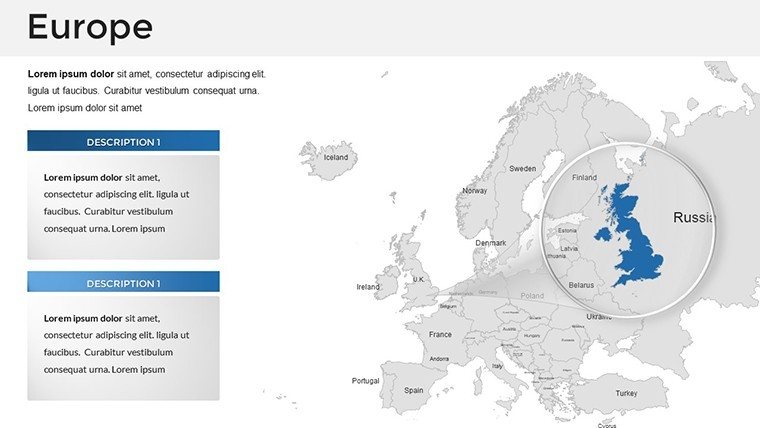
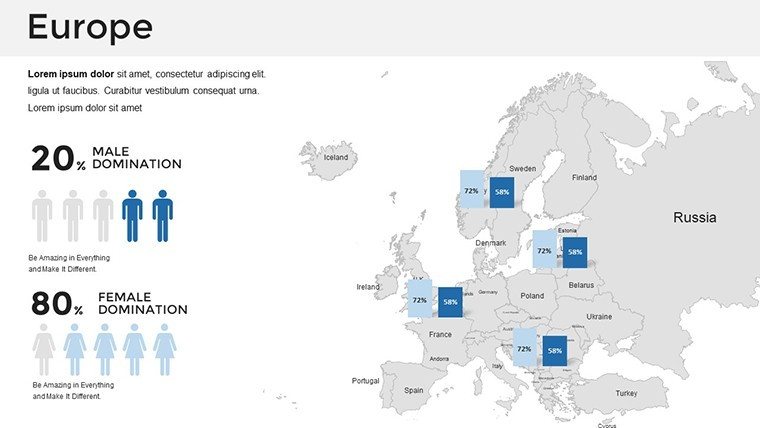
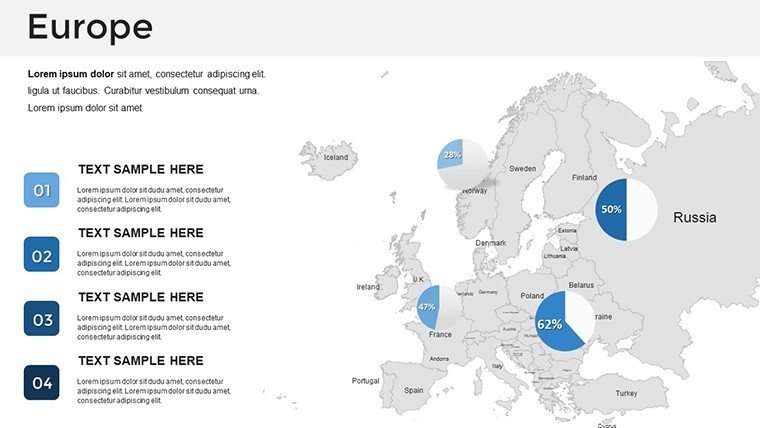
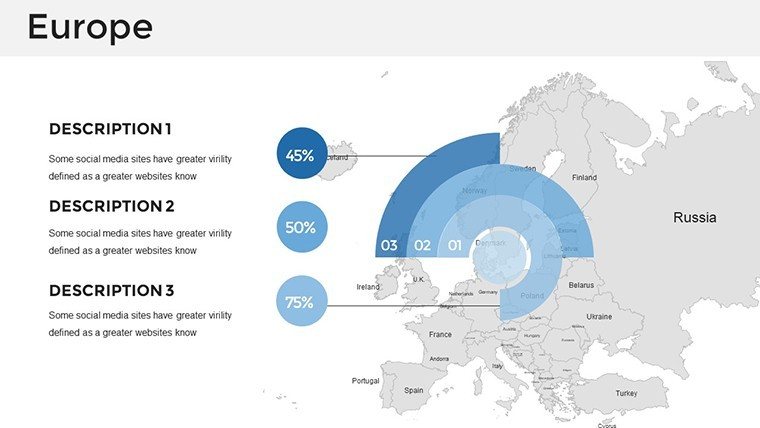
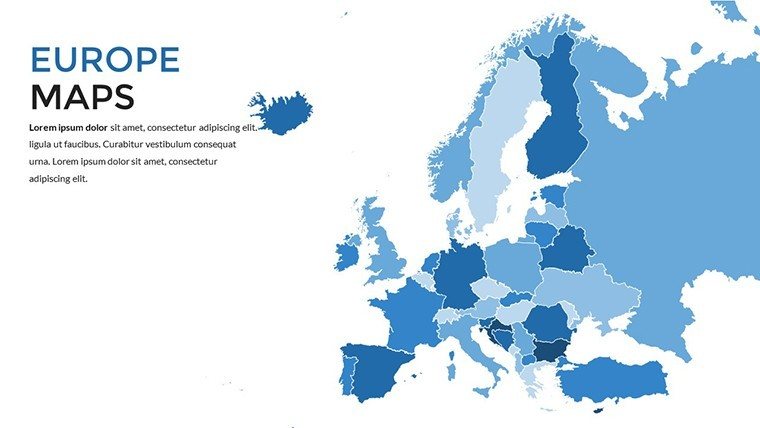
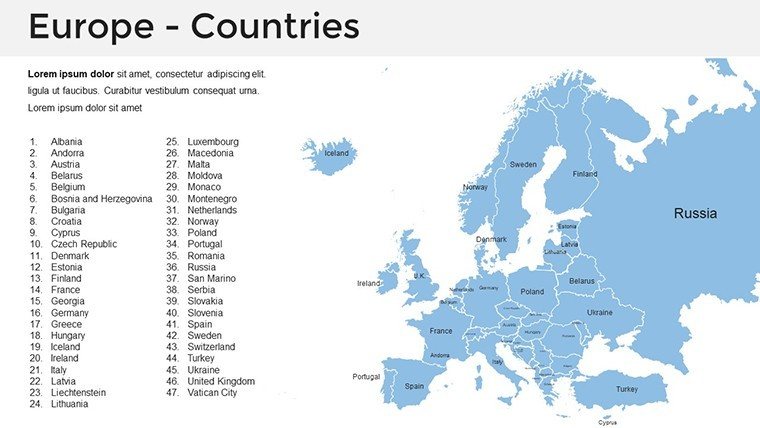
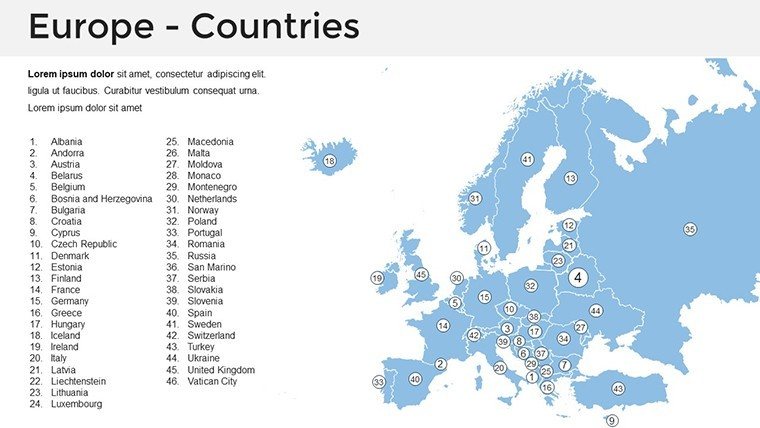
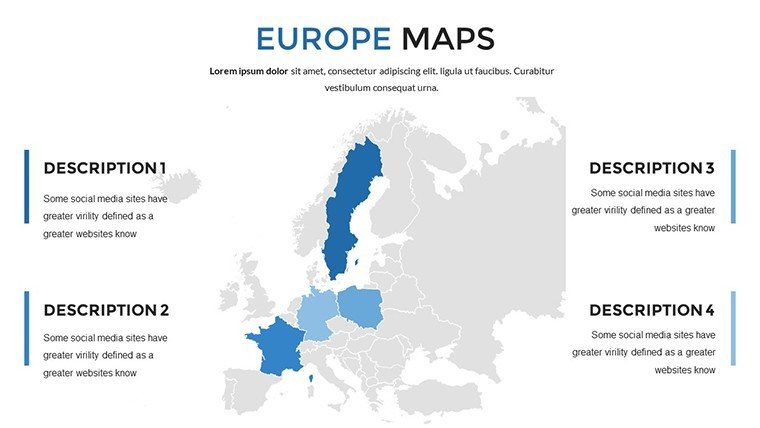
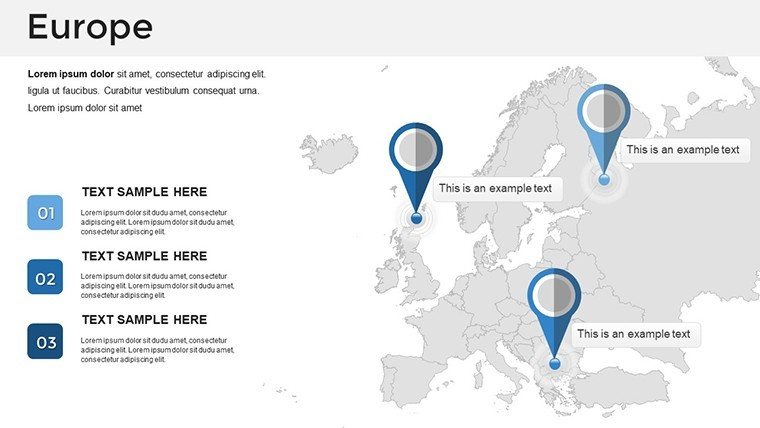
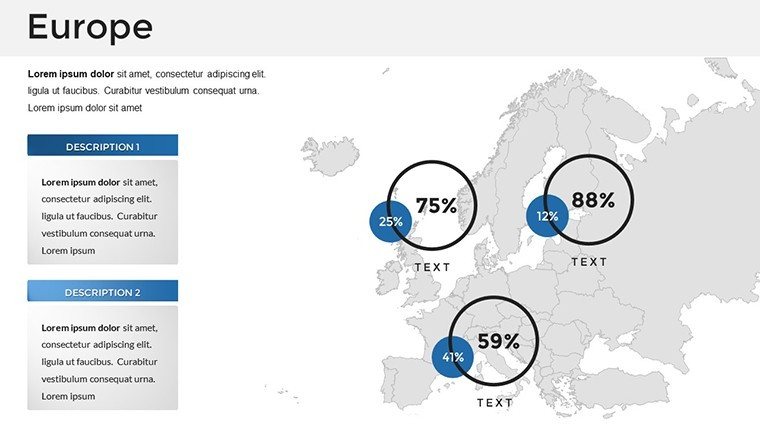
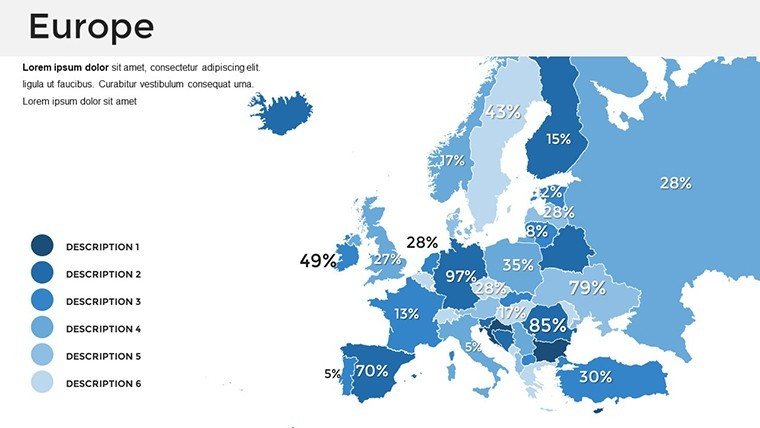
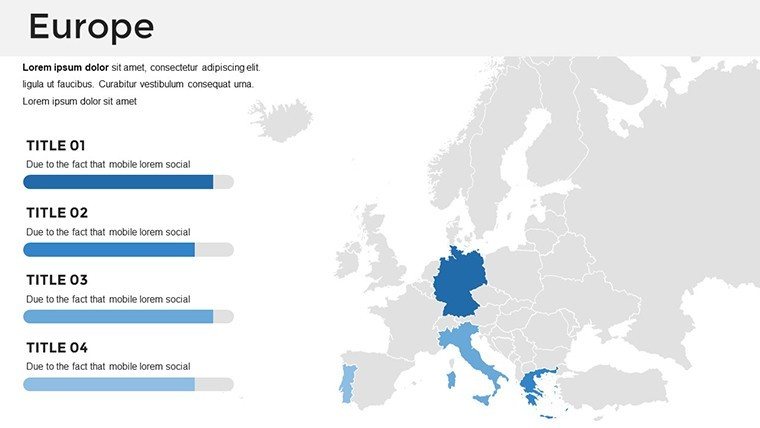
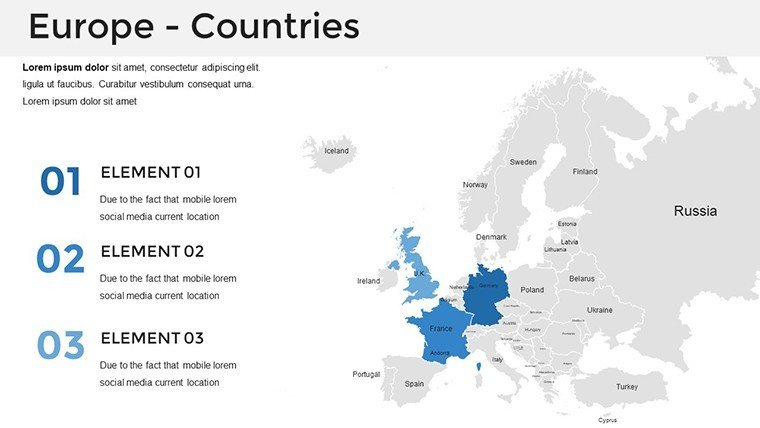
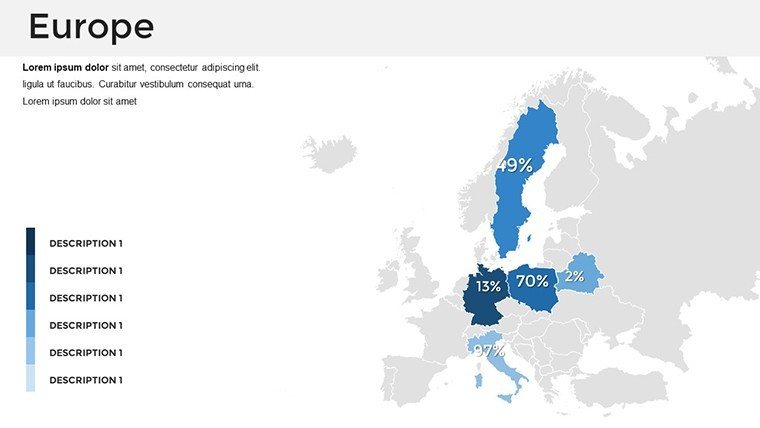
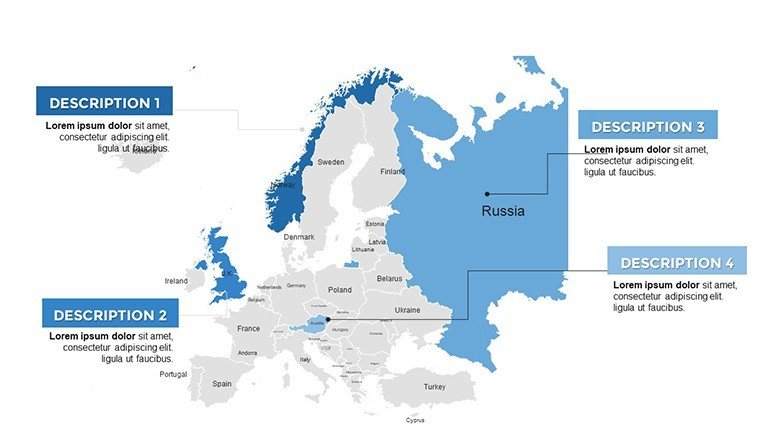
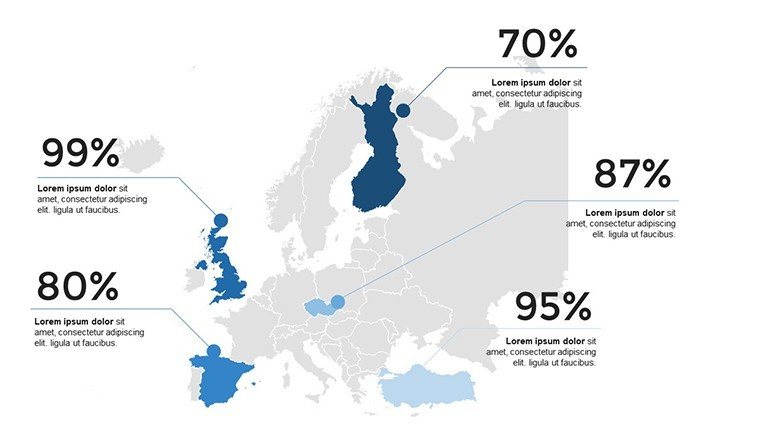
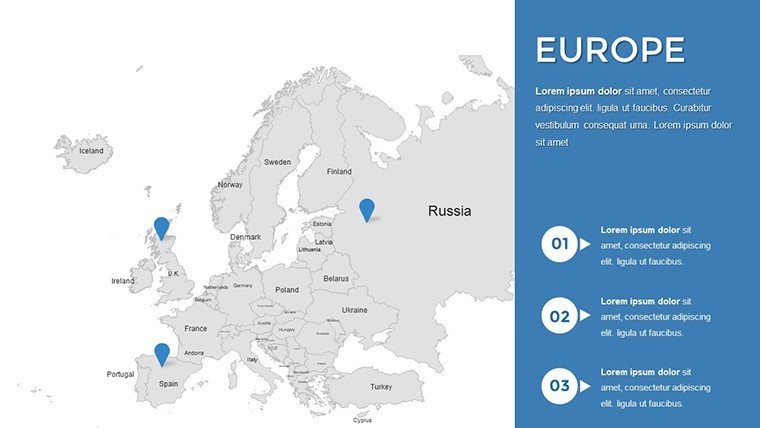
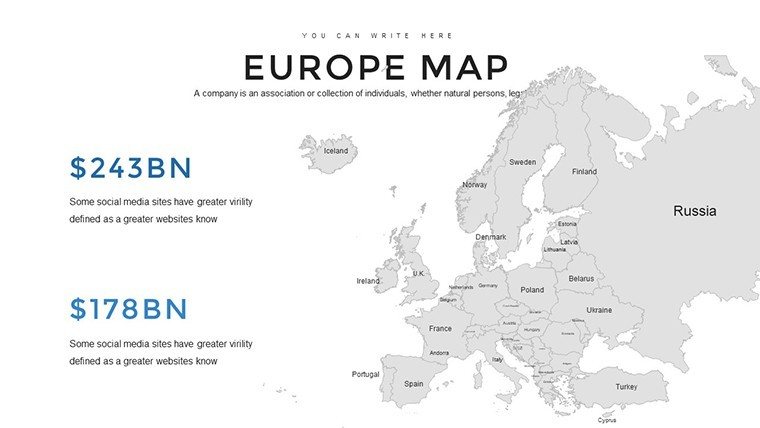
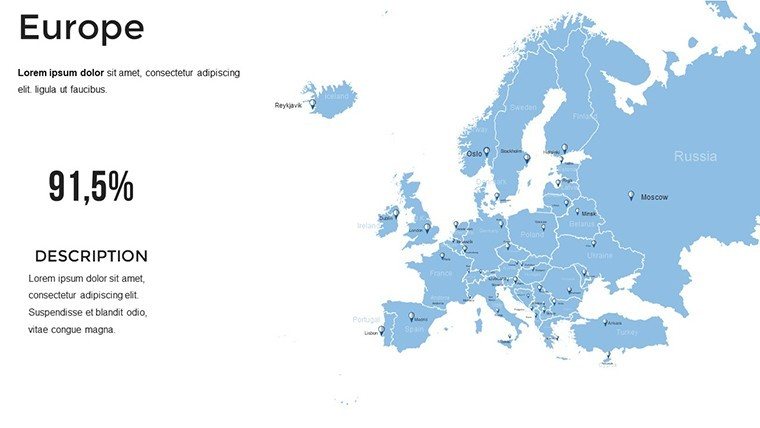
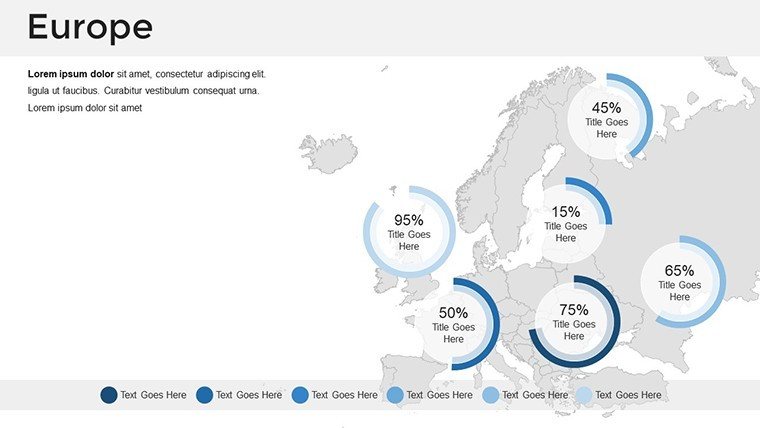
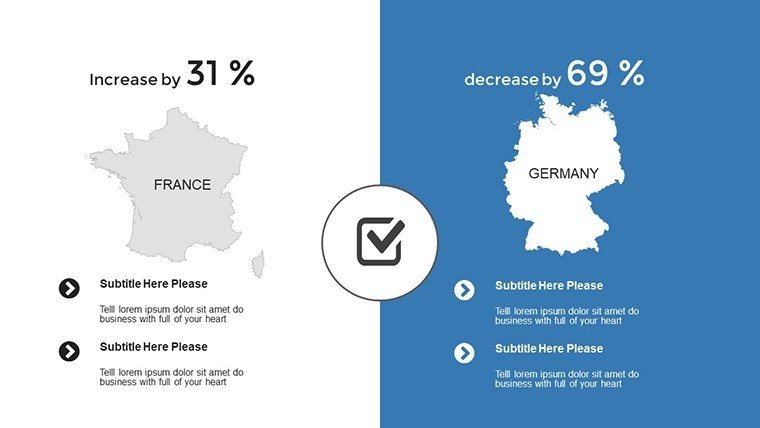
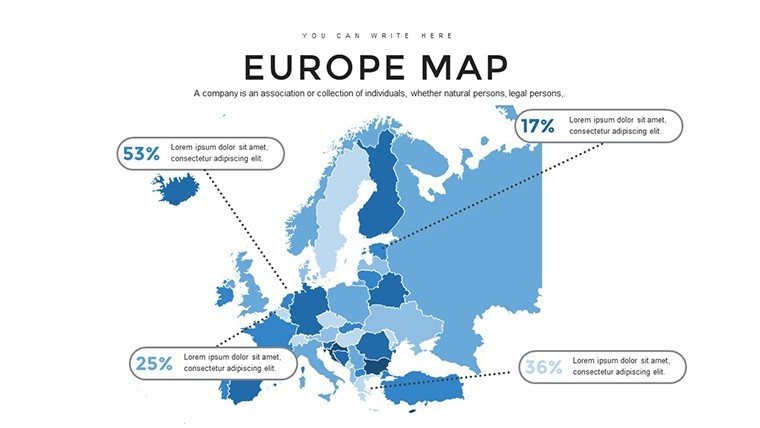
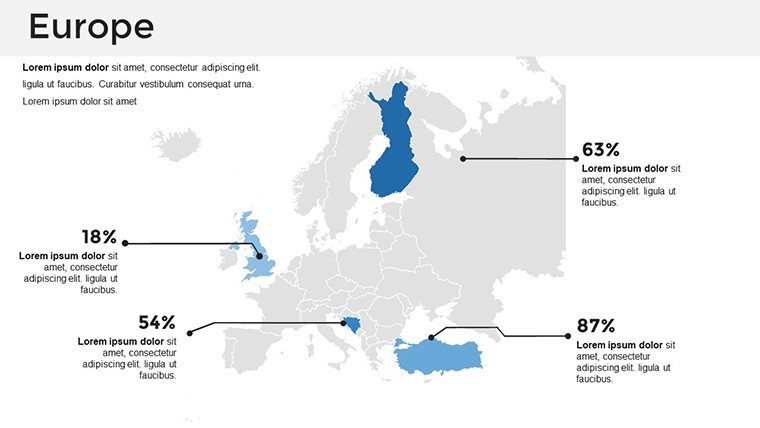
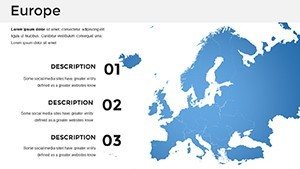
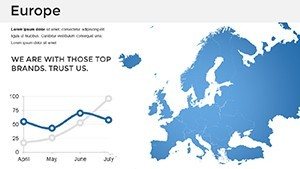
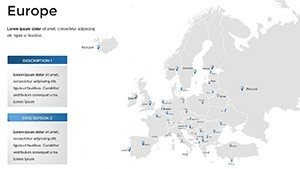
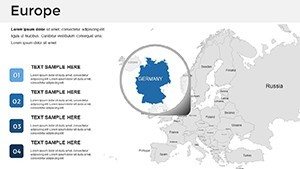
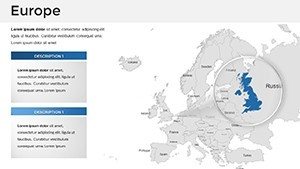
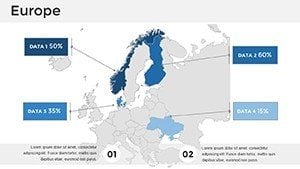
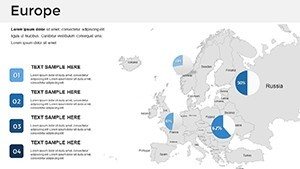
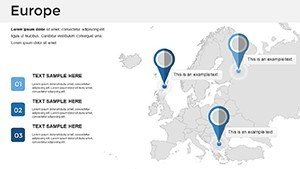
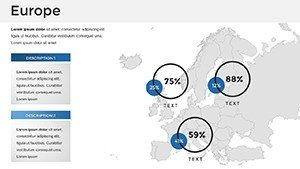
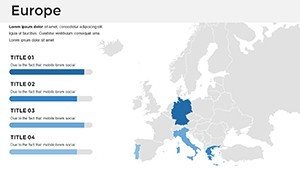
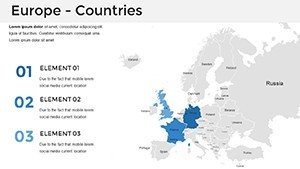
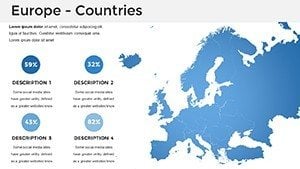
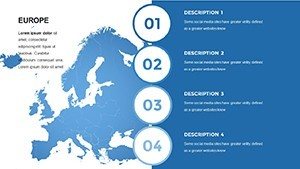
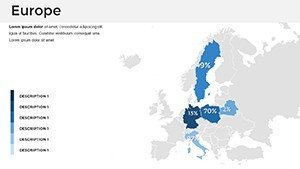
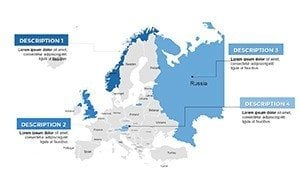
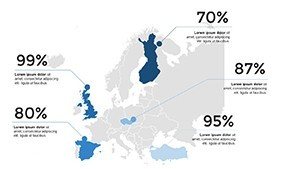
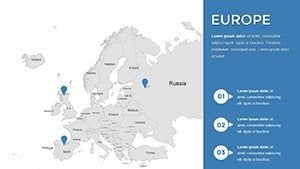
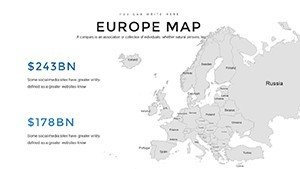
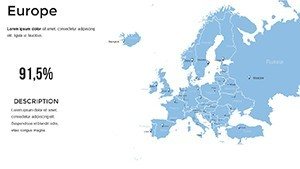
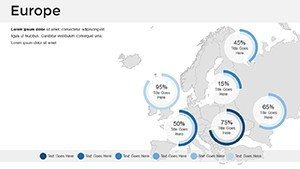
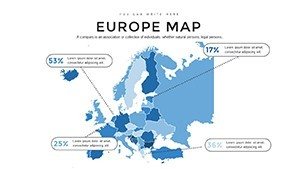
Central to the template are its layered designs: 10 slides for country-specific maps (e.g., France's regions, Germany's Länder), 15 for sub-regional clusters like the Balkans or Scandinavia, and 12 infographic-enhanced national overviews. Infographics - pie charts for GDP, bar graphs for populations - embed directly, allowing data syncing without external tools. Vectors ensure flawless zooming into details like Danube waterways or Alpine passes.
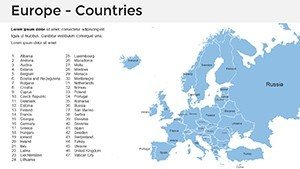
- Country-Focused Maps: Detailed outlines for all 44 European nations, primed for sector-specific highlights.
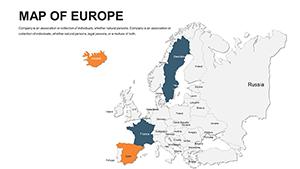
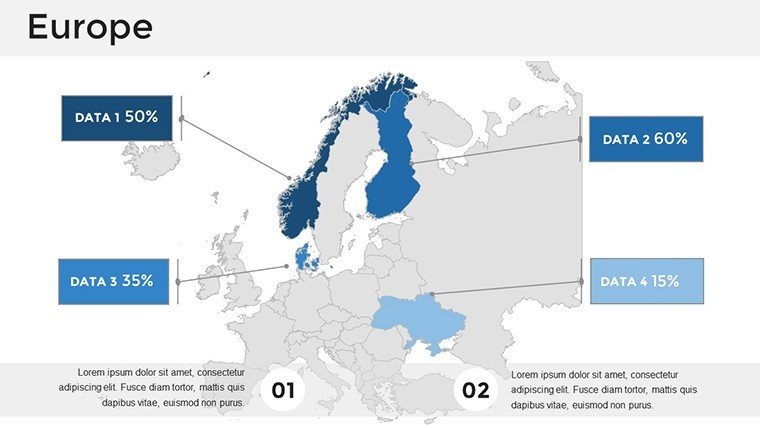
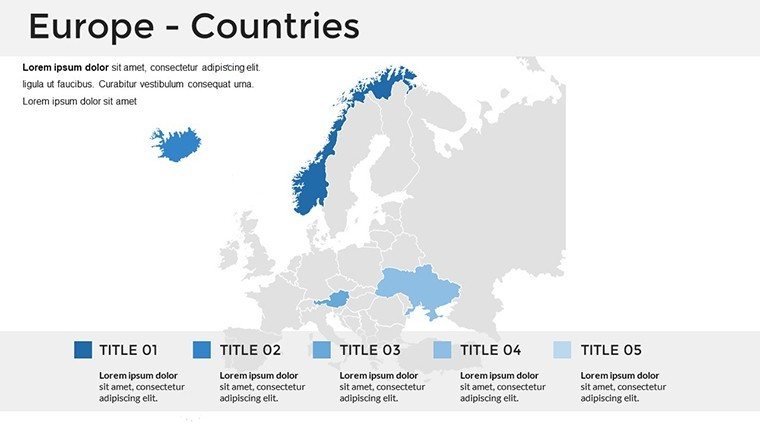
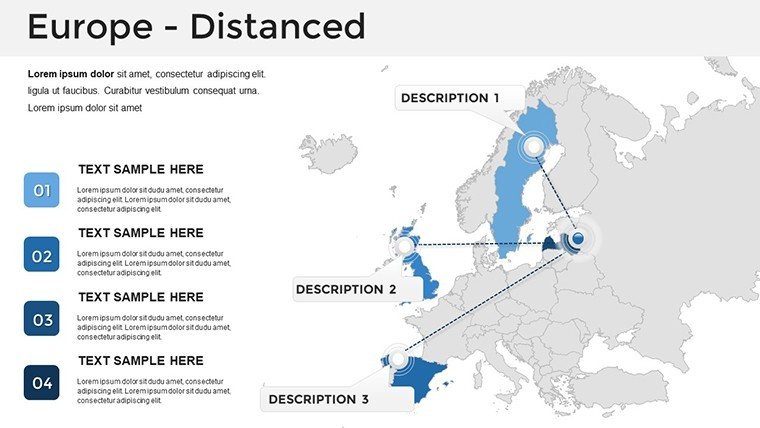
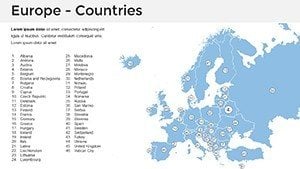
- Sub-Regional Groupings: Thematic clusters for comparative studies, such as Mediterranean vs. Nordic economies.
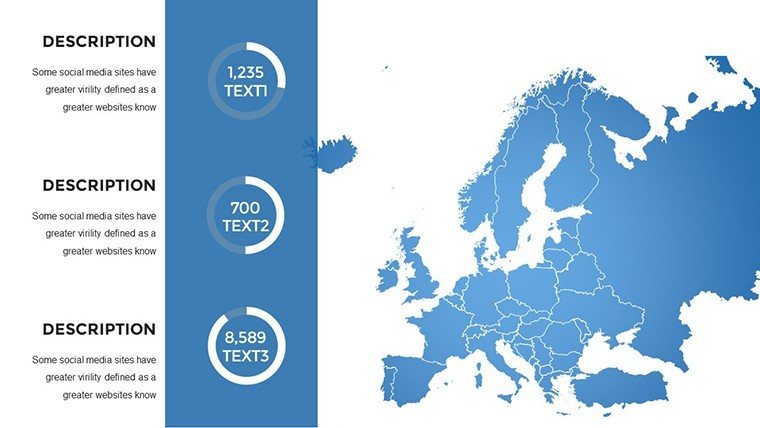
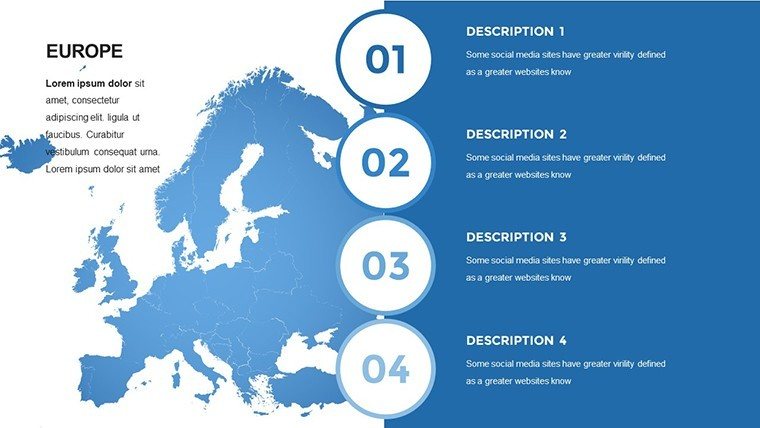
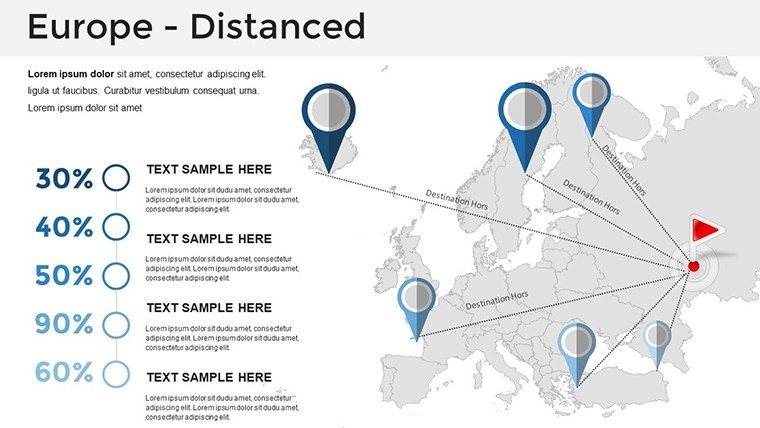
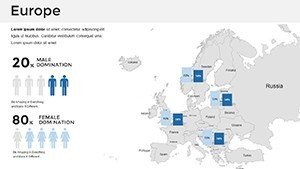
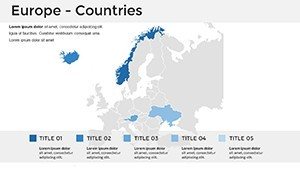
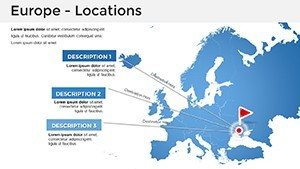
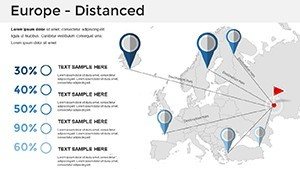
- Infographic Overlays: Built-in visuals for stats, timelines, and flows, customizable to your dataset.
A think tank employed these for a EU policy brief, overlaying migration stats to influence funding - garnering praise for clarity. Themed elements, like euro symbols for finance or wind turbines for green energy, infuse relevance, elevating generic slides to bespoke masterpieces.
Efficient Workflow for Complex Presentations
Implementation is intuitive: Load the .pptx, sequence slides per your agenda, and tweak infographics via drag-and-drop. Google Slides import preserves animations, ideal for remote collaborations. Animate continent-wide reveals, like fading in trade routes, to build suspense. Expert advice: Anchor with a Europe-wide slide, then segment for depth - this echoes analytical frameworks from McKinsey reports.
Efficiency gains are evident; prep time halves versus manual charting. Maintain cohesion with preset themes reflecting Europe's diversity - vibrant for the South, subdued for the North.
Targeted Applications in Professional Arenas
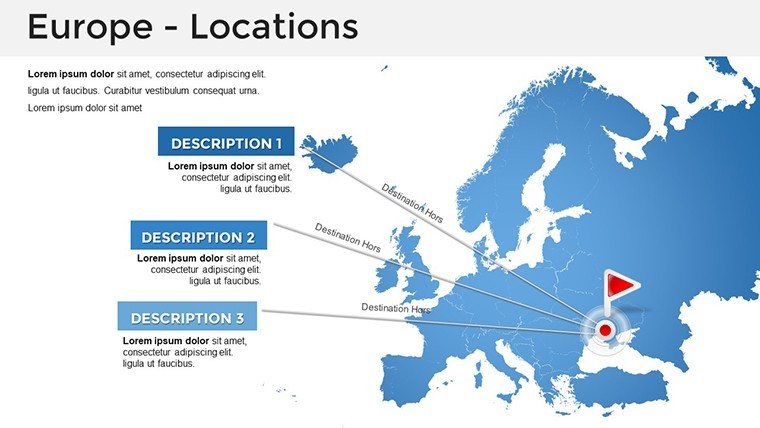
Versatility defines this template. Corporates map supply chains from Poland to Portugal, using flow arrows for logistics - a method that streamlined a manufacturer's ops by 30%. Academics visualize historical unions, animating the EU's evolution for engaging lectures per Bologna Process ideals.
Policymakers highlight climate vulnerabilities, shading flood zones in the Netherlands, backed by EEA data. In diplomacy, outline alliances with neutral overlays, fostering informed dialogues. For market research, integrate consumer trends across the Eurozone, driving targeted campaigns.
- Strategic Planning: Chart expansion paths with risk-infused colors.
- Academic Research: Embed citations in infographics for scholarly rigor.
- Policy Advocacy: Layer impact metrics for grant-winning proposals.
- Global Trade: Visualize tariffs and routes for negotiation prep.
Superior to stock images, it offers data interactivity and multi-format exports. Research from Harvard Business Review indicates mapped visuals amplify persuasion by 70%, a game-changer for influencers.
Optimization Strategies for Peak Performance
Strategize layers: Base geography first, then infographics atop. For zest in educational decks, caption curiosities like "Birthplace of the Euro." Validate on varied displays for consistency. Scalable for webinars or print, it supports hybrid formats seamlessly.
Pair with executive summaries for comprehensive briefs. A recurring asset for annual EU updates or cross-border projects.
Elevate with Expert-Level European Visuals
Distinguishing factor? Infographic synergy with precise cartography, outpacing freebies in depth and polish. Cost-effective alternative to ArcGIS, with instant accessibility. Its reliability cements your authority.
Chart Europe's future now - download and infuse a slide today. Command attention with maps that unite data and destiny.
Frequently Asked Questions
How do the infographics integrate with maps?
Seamlessly editable, allowing data import and styling to complement geographic elements.
Is it compatible with Google Slides?
Yes, full fidelity upon import for collaborative editing.
Can I use it for policy presentations?
Ideal, with accurate layers supporting governmental and NGO needs.
Are all European countries covered?
Comprehensive, including 44 nations from micro-states to majors.
Does it include animation options?
Pre-set for reveals, plus customizable for flows and highlights.
What about commercial licensing?
Fully permitted for business, academic, and professional applications.