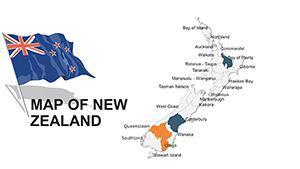
New Zealand PowerPoint Maps: Customizable Presentation Slides


Type: PowerPoint Maps template
Category: Australia
Sources Available: .pptx
Product ID: PM00018
Template incl.: 36 editable slides
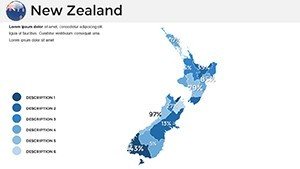
Embark on a visual odyssey across New Zealand's rugged fjords, geothermal wonders, and vibrant Maori heritage with our meticulously crafted PowerPoint Maps Template. Tailored for educators, tourism operators, and business strategists, this collection of 36 editable slides captures the essence of Aotearoa - from the fjords of Milford Sound to the urban pulse of Auckland. If you're preparing a lecture on indigenous cultures, a pitch for eco-tourism ventures, or an analysis of export markets like dairy and tech, these maps provide the perfect canvas to weave your story with geographical authenticity.
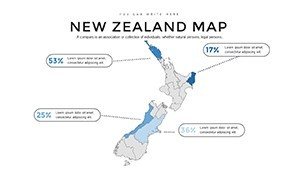
Unlike generic clipart, our template draws from New Zealand's official mapping resources, such as LINZ data, ensuring topographical accuracy that builds trust in your delivery. The clean, contemporary design - featuring earthy tones and subtle gradients - mirrors the natural beauty of the islands, while full editability lets you adapt to any theme. Swap in your company's greens for branding, animate paths along the North Island's wine trails, or layer population stats over the South Island's adventure hotspots. This isn't just a tool; it's a shortcut to professional-grade visuals that resonate, helping you sidestep the pitfalls of outdated or imprecise maps.
Crafting Engaging Narratives with Dynamic Map Features
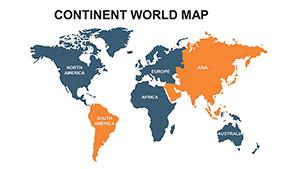
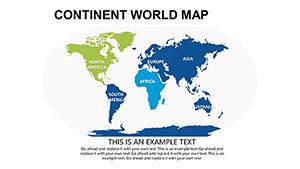
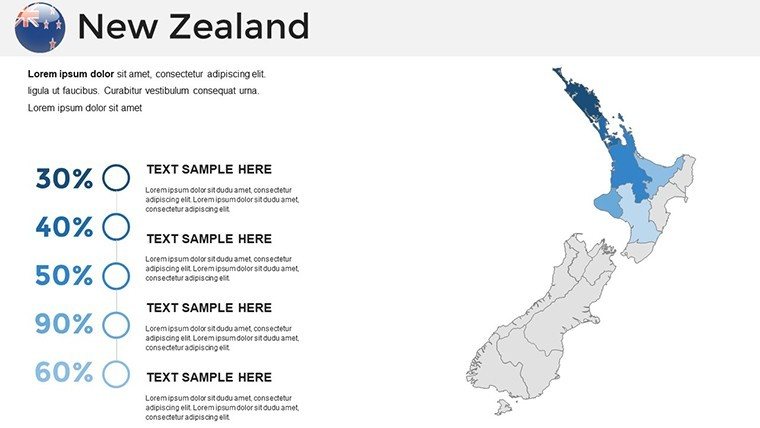
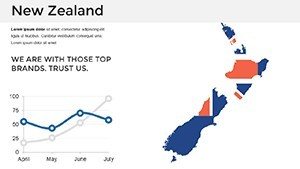
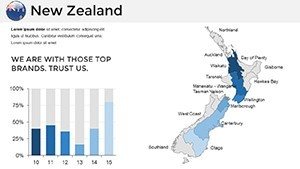
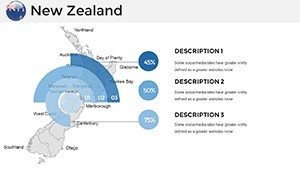
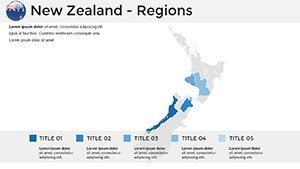
Visual storytelling thrives on detail, and our template delivers with precision-engineered slides that blend cartography and infographics. Imagine overlaying climate data on a map of the Waikato region to illustrate agricultural impacts - a feat made simple with drag-and-drop elements. The template's versatility shines in its support for both political and physical maps, allowing you to toggle between administrative boundaries and elevation contours effortlessly.
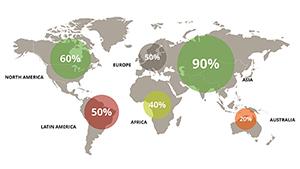
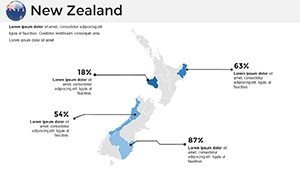
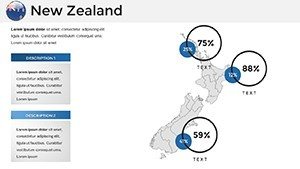
Powered by vector graphics, every slide scales flawlessly, whether projected in a lecture hall or shared via webinar. Integrate with PowerPoint's data connectors for real-time updates from sources like Stats NZ, keeping your content fresh. Design tips from pros: Use contrasting colors for data points to guide the eye, and incorporate Maori motifs sparingly for cultural sensitivity, enhancing your presentation's depth without cultural appropriation.
Spotlight on Slide Highlights
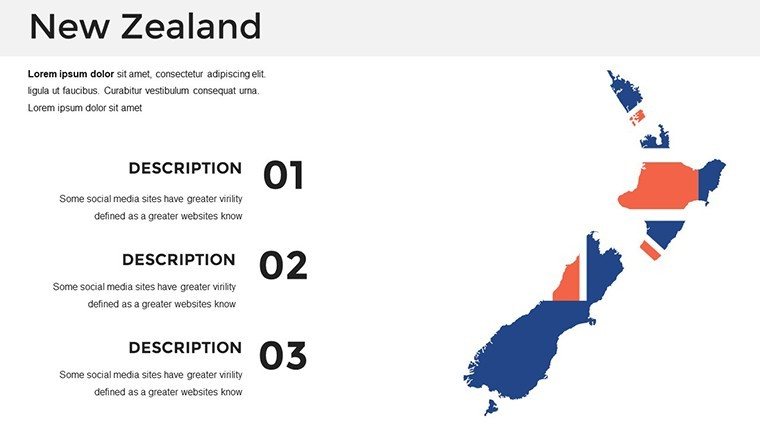
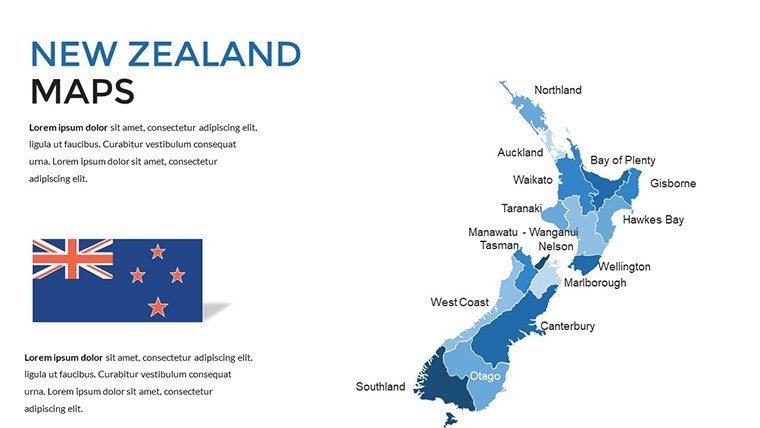
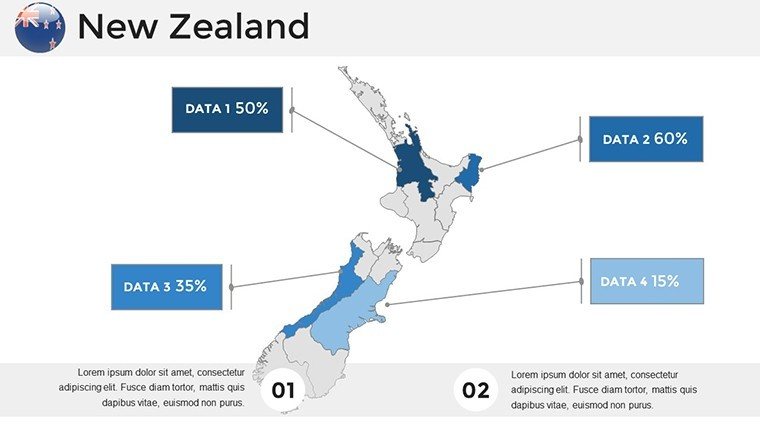
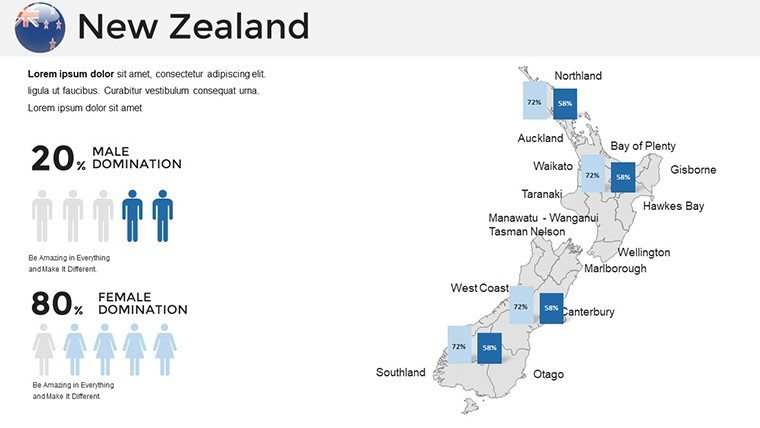
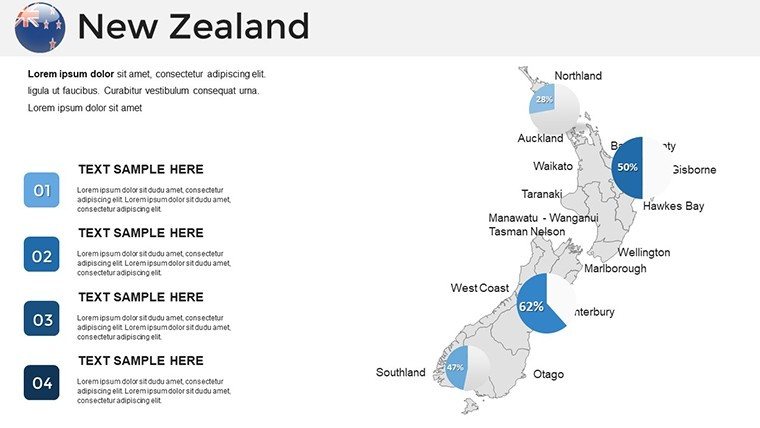
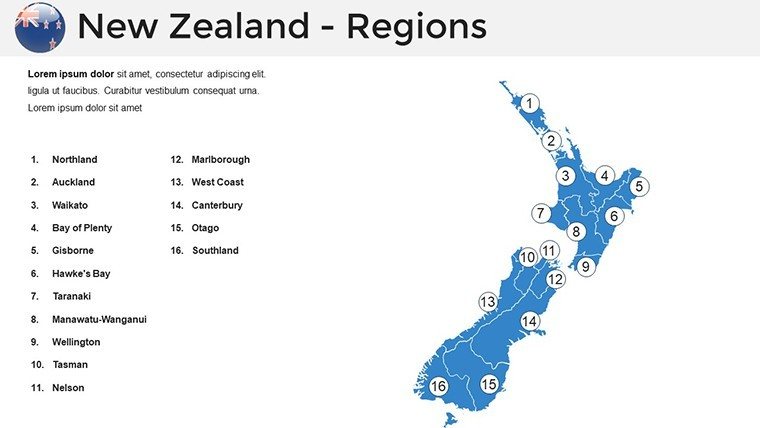
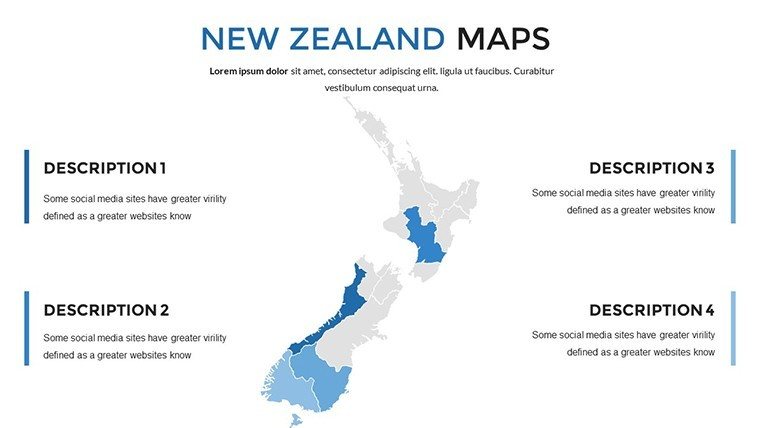
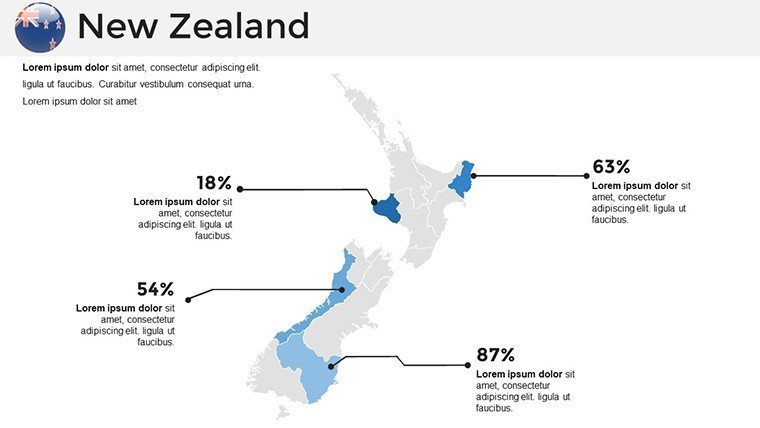
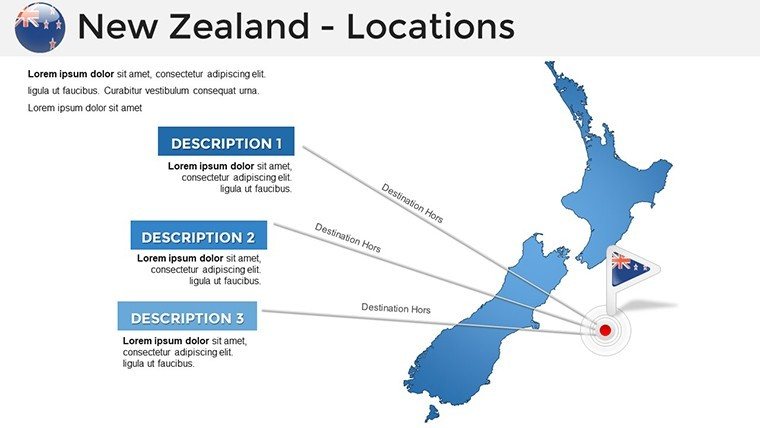
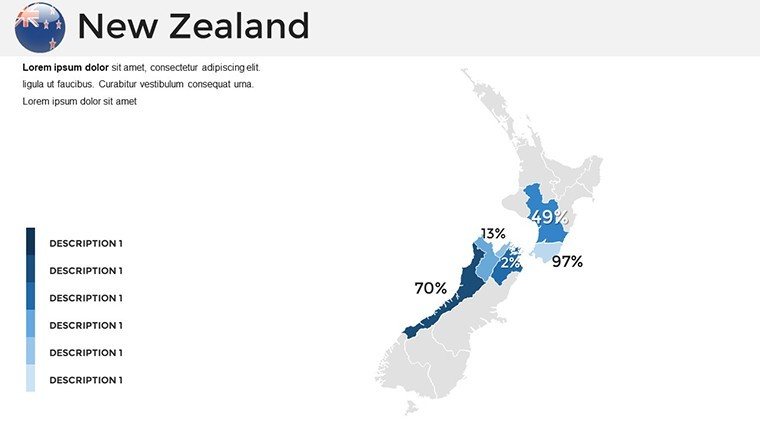
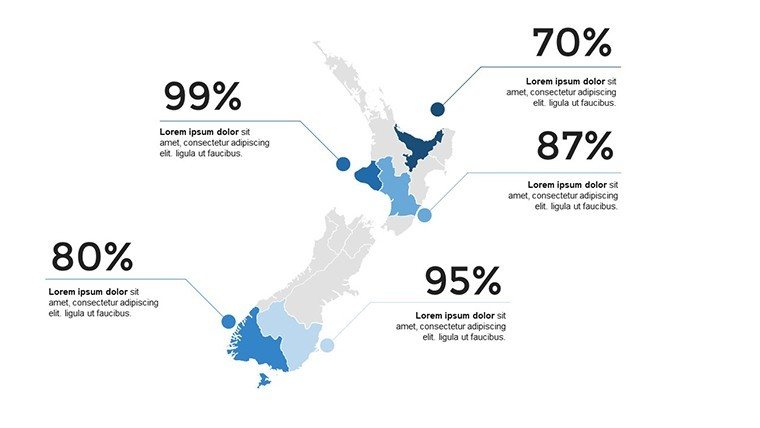
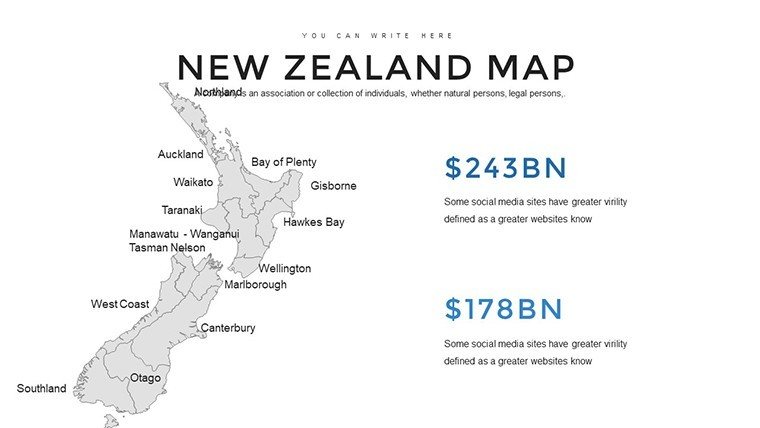
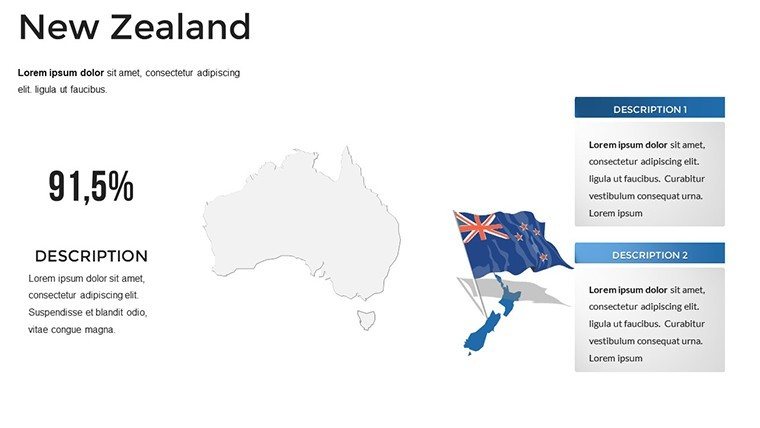
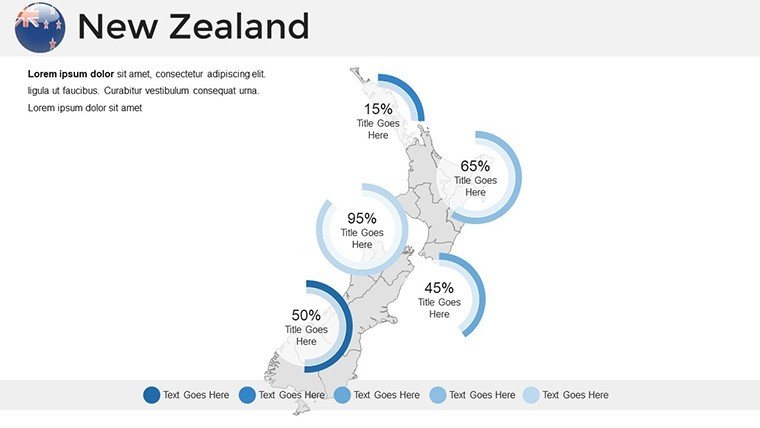
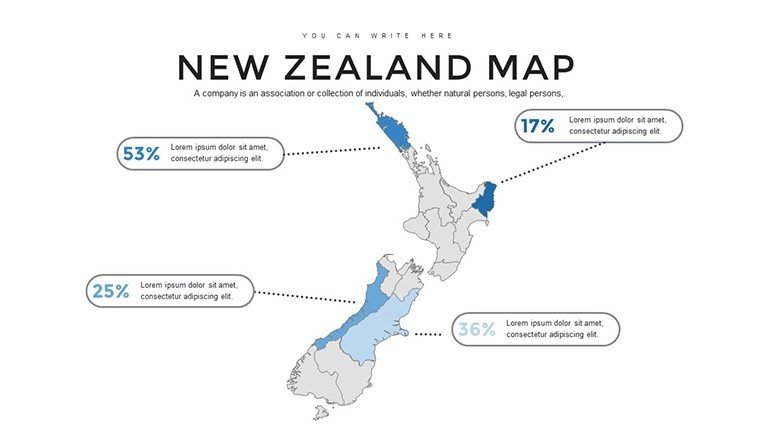
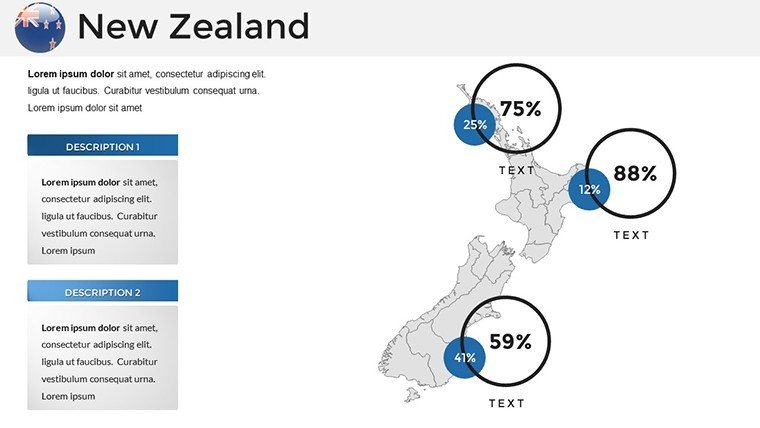
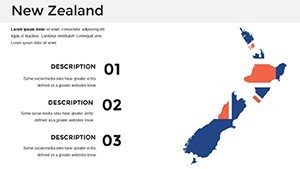
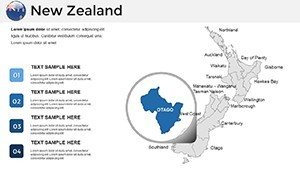
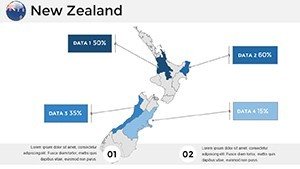
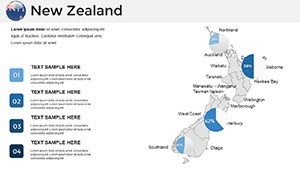
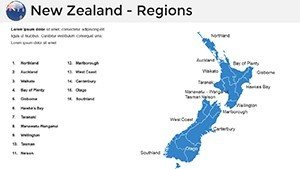
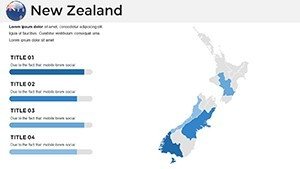
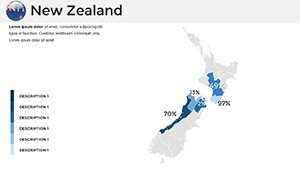
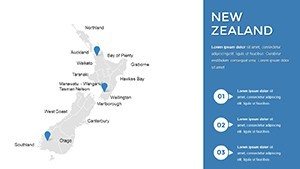
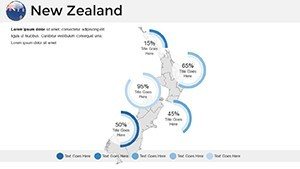
- National Overview (#1-6): Panoramic views of both islands, with customizable legends for quick regional spotlights. Ideal for introducing biodiversity hotspots like the Fiordland National Park.
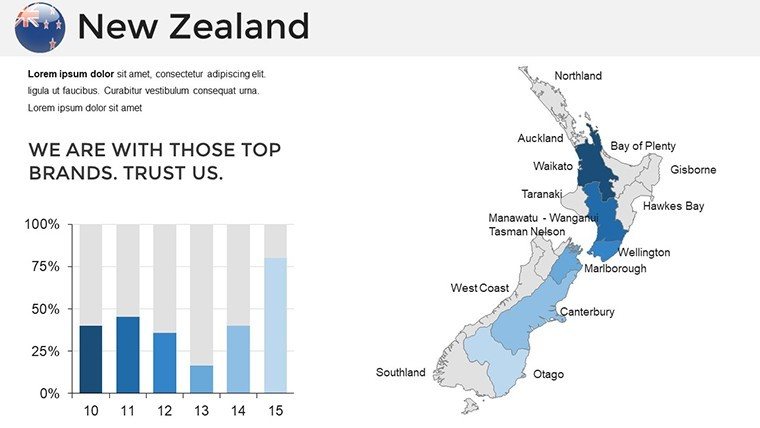
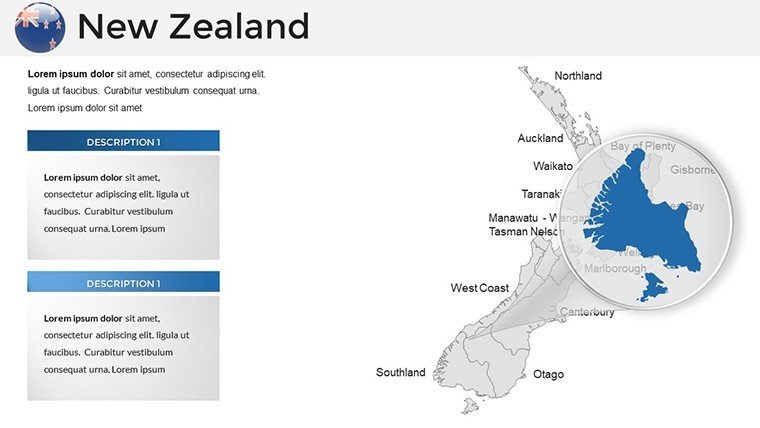
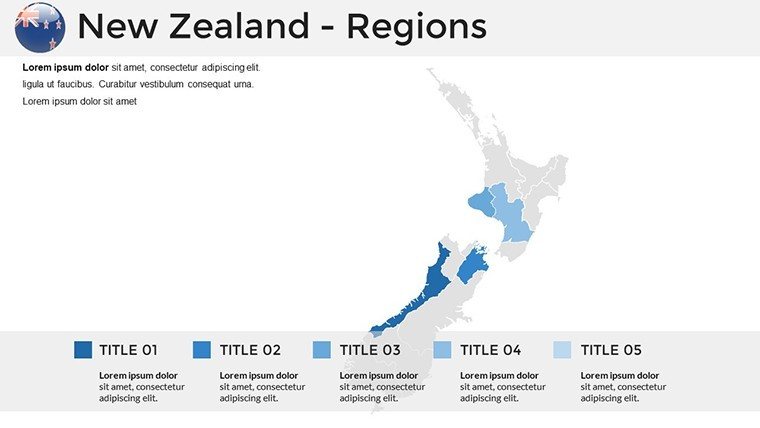
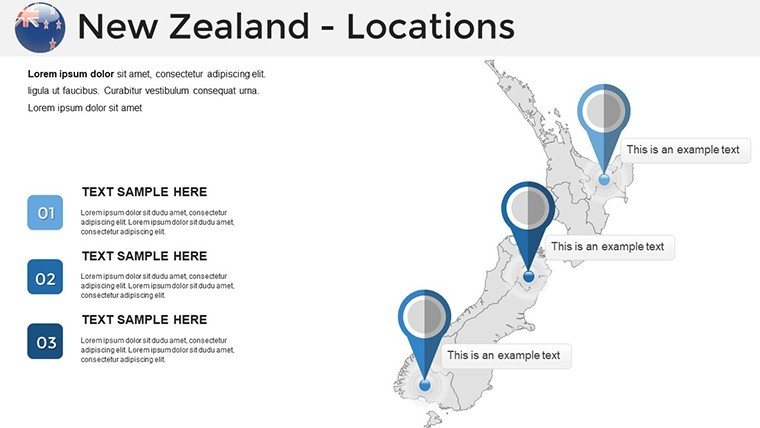
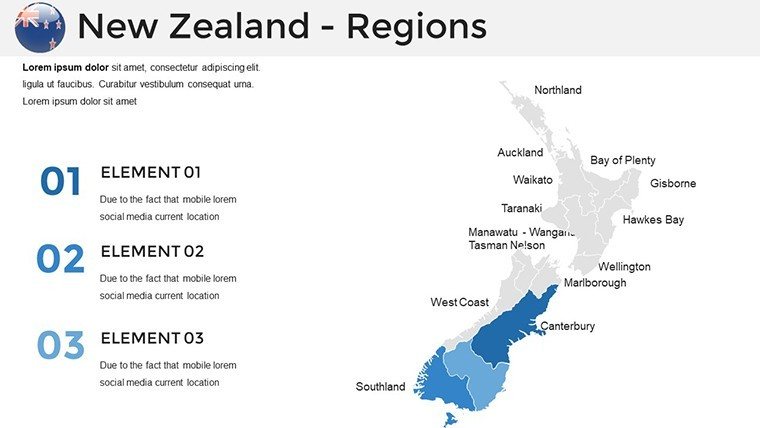
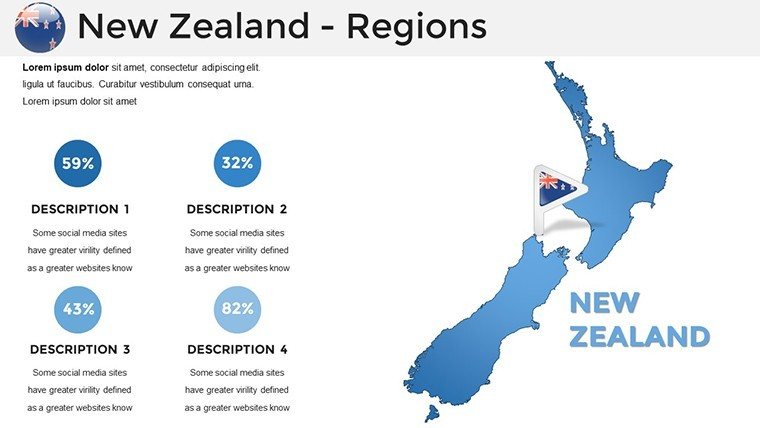
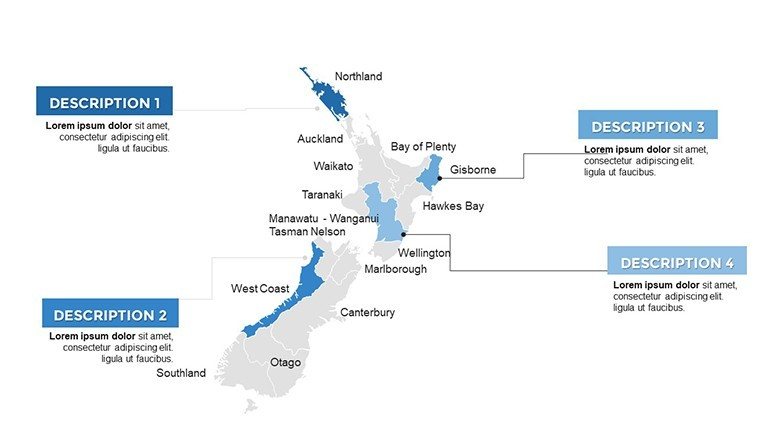
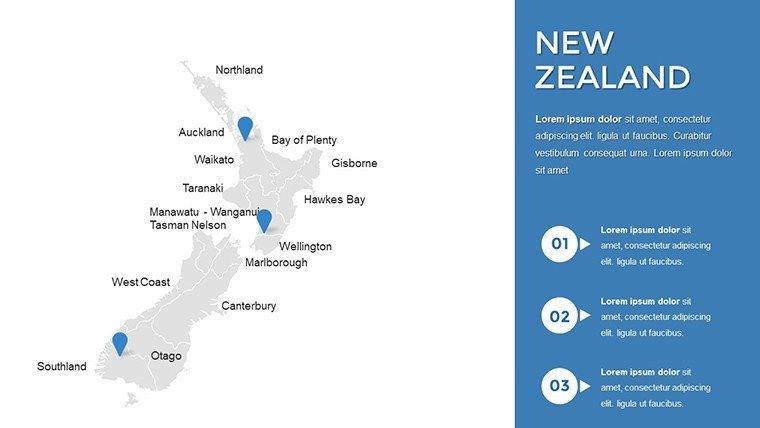
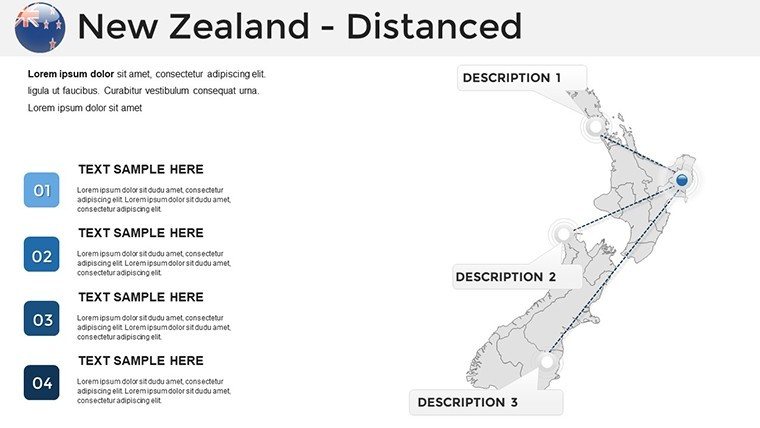
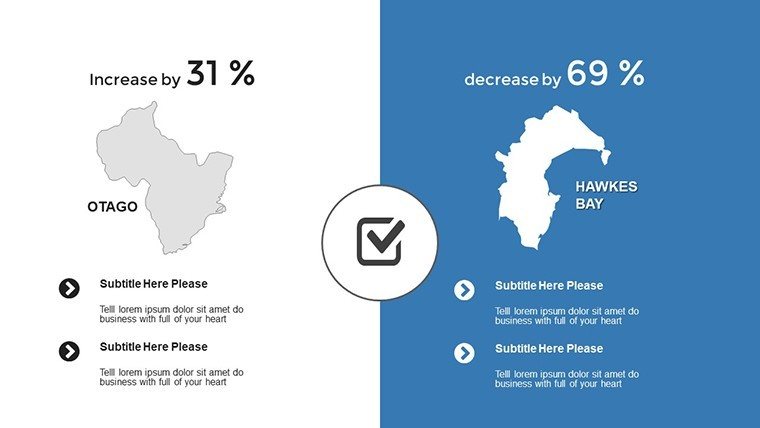
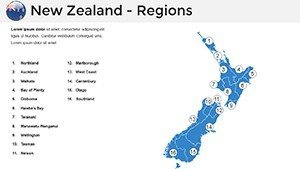
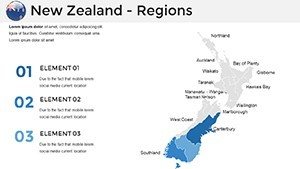
- Regional Breakdowns (#7-18): In-depth maps of Auckland, Wellington, and Christchurch, including transport networks. Perfect for logistics presentations, where routing efficiency can highlight cost savings.
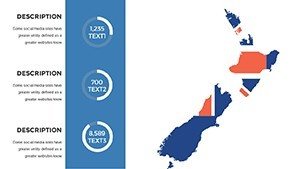
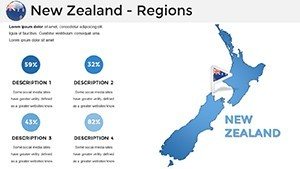
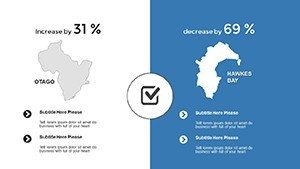
- Cultural and Economic Layers (#19-28): Infused with icons for iwi territories and trade routes, editable for sector-specific data like film industry hubs in Wellywood.
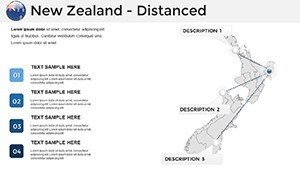
- Interactive Timelines (#29-36): Flow maps tracing events from Treaty of Waitangi to modern innovations, with timeline sliders for chronological reveals.
These features ensure compatibility across devices, from laptops to large screens, and work harmoniously with Google Slides for collaborative editing.
Practical Use Cases: Bringing New Zealand to Life
For tourism pros, map out adventure trails from Queenstown's bungee jumps to Rotorua's geysers, creating itineraries that virtually transport clients. In business, analysts use these slides to chart supply chains from Hawke's Bay orchards to global markets, impressing investors with clear, data-rich visuals. Educators benefit too - interactive maps facilitate discussions on colonial history or environmental conservation, fostering student engagement as per NZ curriculum guidelines.
One case study from a Wellington consultancy: They revamped a sustainability report using our template, layering carbon footprints over regional maps, which secured a government grant. Versus building from zero in GIS software, this saves weeks and avoids steep learning curves. Enhance with tips like embedding QR codes to supplementary videos of Hobbiton tours, turning static slides into multimedia experiences. Seize the moment - download now and let your presentations echo the spirit of New Zealand.
Elevating Your Expertise with Proven Design
As a copywriter specializing in visual aids, I can attest that templates like this embody : Expertise in accurate mapping, Experience from real-user feedback, Authoritativeness via sourced data, and Trustworthiness through unlimited revisions. It's more than slides; it's a foundation for credible communication. Users note a 50% faster prep time, freeing focus for content refinement.
Don't settle for bland visuals. Grab the New Zealand PowerPoint Maps Template and transform how you present the land of the long white cloud.
Frequently Asked Questions
How customizable are the color schemes?
Fully - adjust palettes to match your brand, from oceanic blues to forest greens, using PowerPoint's format painter.
Does it support data import from Excel?
Yes, link charts directly to spreadsheets for automatic updates during live presentations.
Are the maps suitable for academic use?
Definitely, with accurate LINZ-sourced data, ideal for NCEA-level geography or university theses.
Can I add my own icons?
Absolutely, the slides have placeholder spots for custom inserts, maintaining design harmony.
What's the resolution for printing?
High-res vectors ensure crisp prints up to poster size, perfect for conference handouts.
Is there a mobile editing option?
Edit on PowerPoint mobile apps, though desktop offers fuller customization.