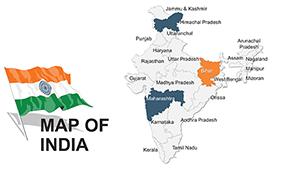
India PowerPoint Maps Template: Visualize Diversity with Ease


Type: PowerPoint Maps template
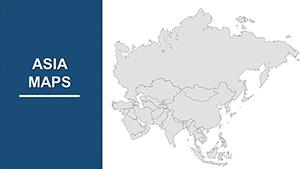
Category: Asia
Sources Available: .pptx
Product ID: PM00015
Template incl.: 36 editable slides
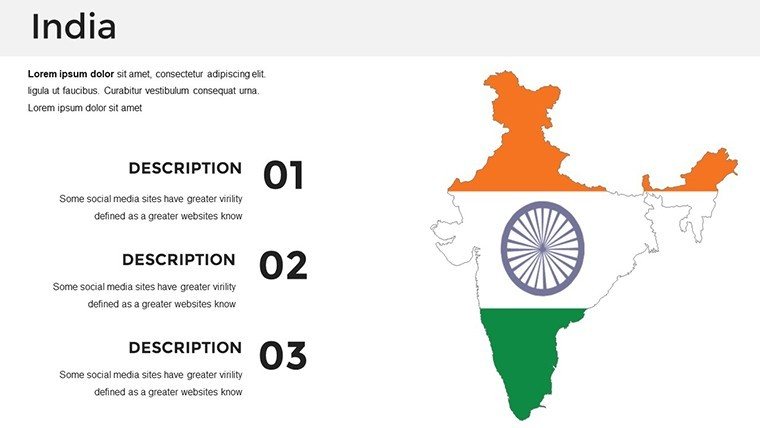
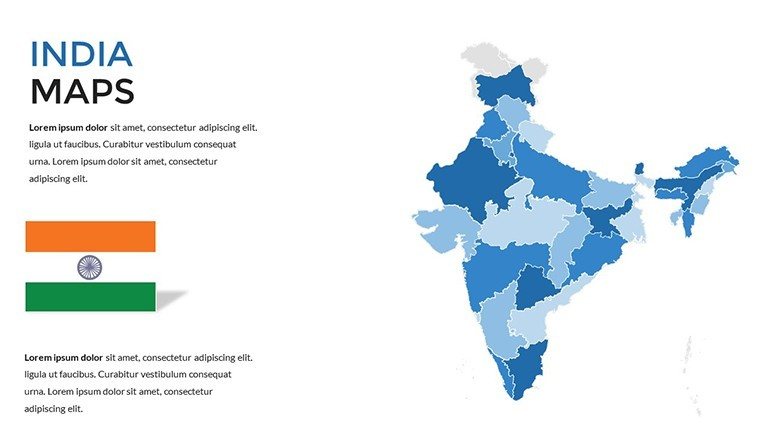
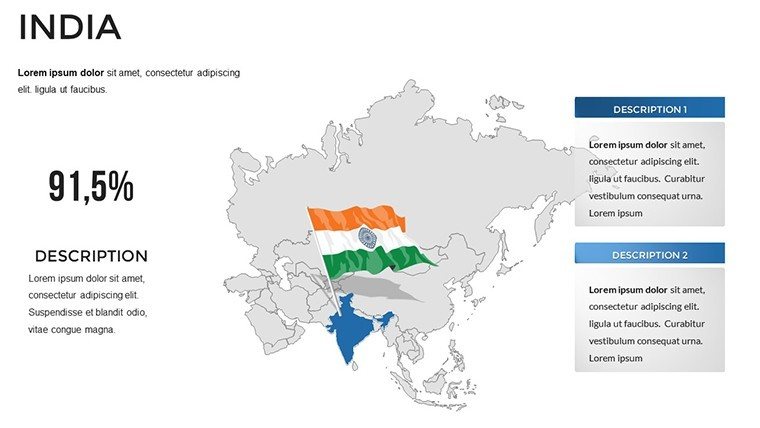
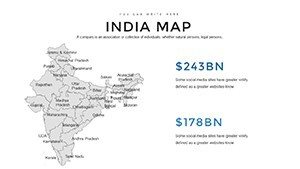
From the snow-capped Himalayas to the tropical shores of Kerala, India's mosaic of cultures and economies demands a presentation tool that captures its essence. Enter our 36-slide India PowerPoint Maps Template, a versatile asset for professionals aiming to illustrate demographic shifts, business opportunities, or historical timelines. With editable elements that let you pinpoint cities like Mumbai or Delhi, this template draws on cartographic expertise akin to the Survey of India's standards, ensuring reliable visuals that enhance your expertise. Ideal for seminars on sustainable development or pitches for market expansion, it features high-quality graphics compatible with PowerPoint and Google Slides. Customize colors to reflect regional vibrancy - greens for fertile Punjab plains or blues for coastal Maharashtra - and integrate data for narratives that stick. This template bridges the gap between information and inspiration, helping you craft stories that resonate in boardrooms or lecture halls alike.
Crafting Compelling Narratives: Core Features at Your Fingertips
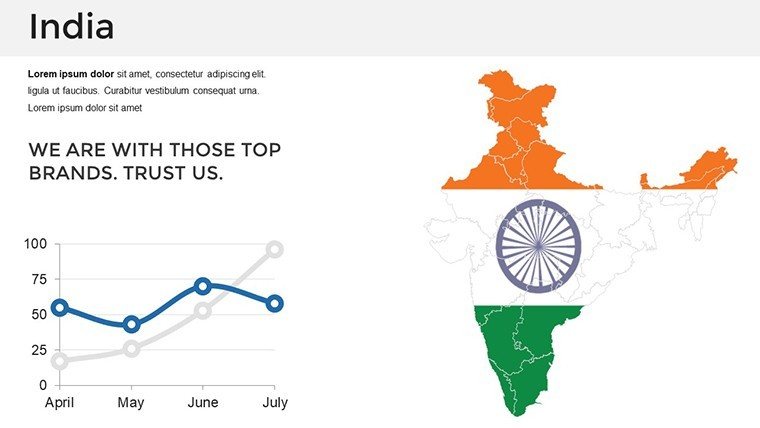
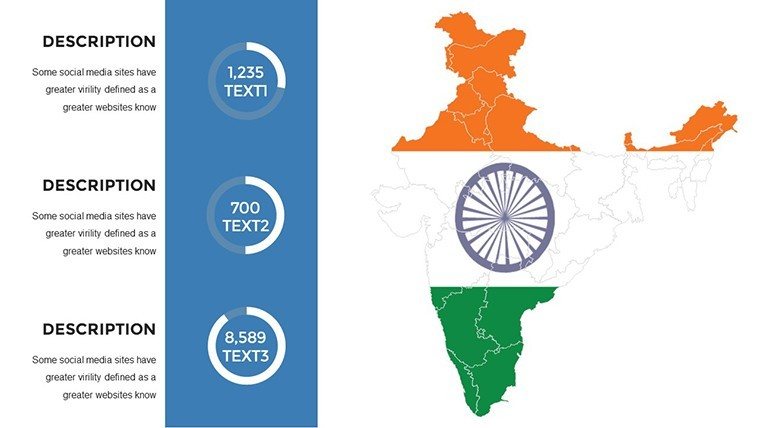
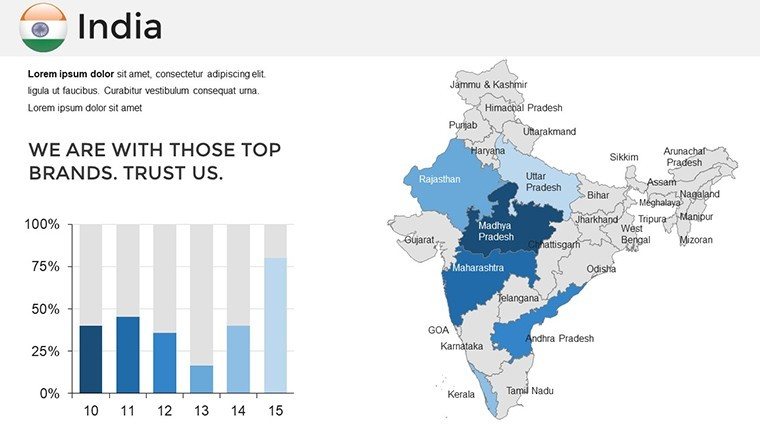
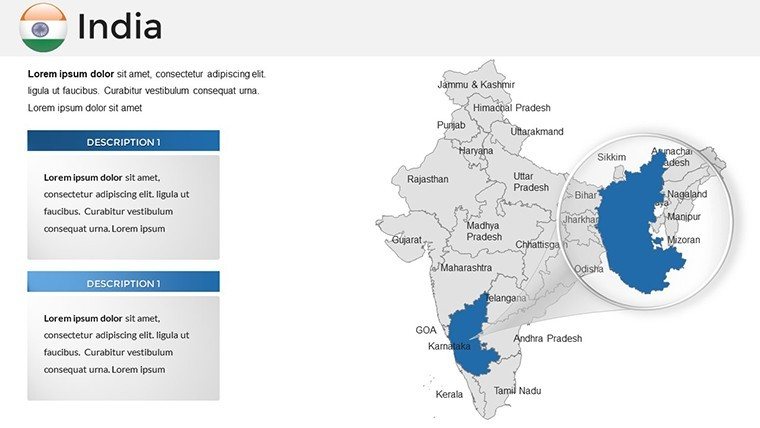
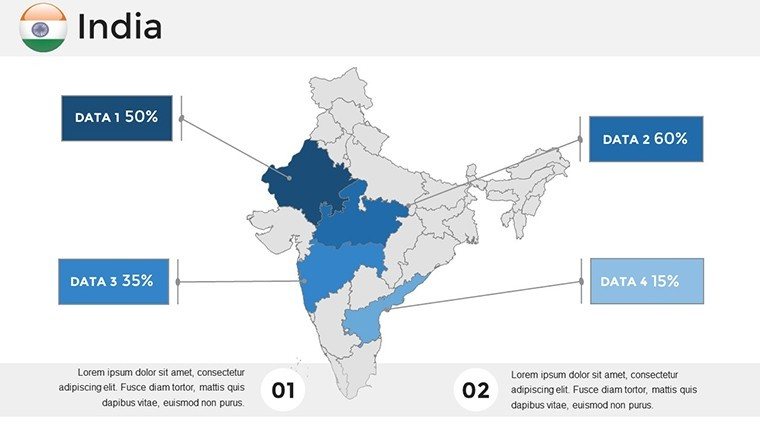
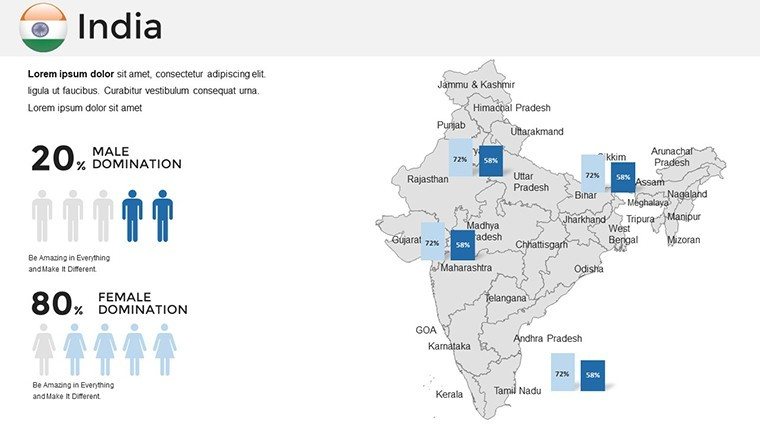
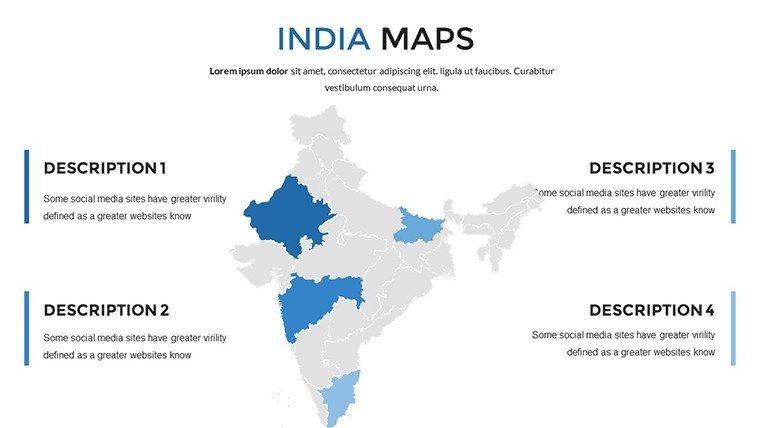
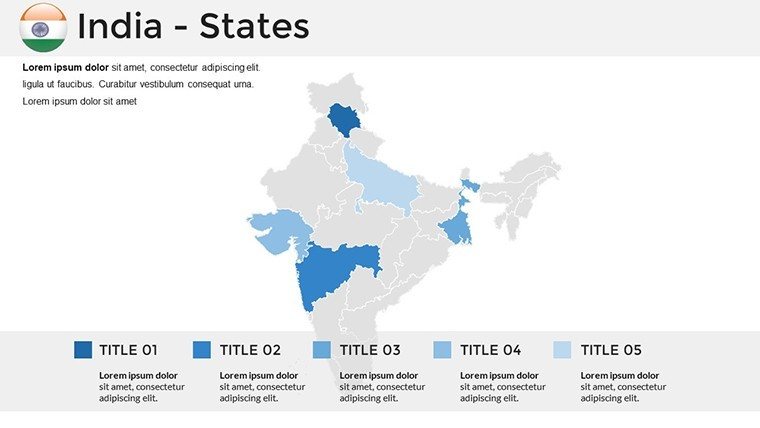
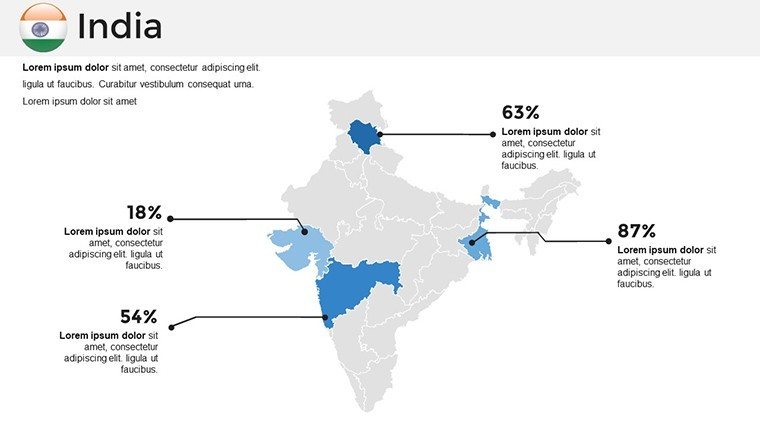
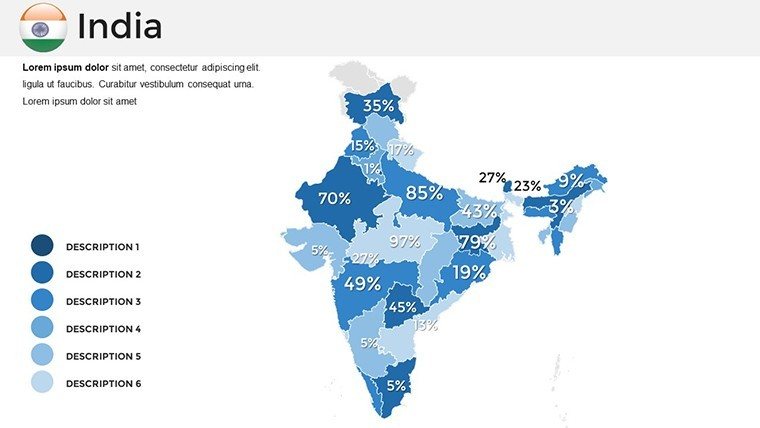
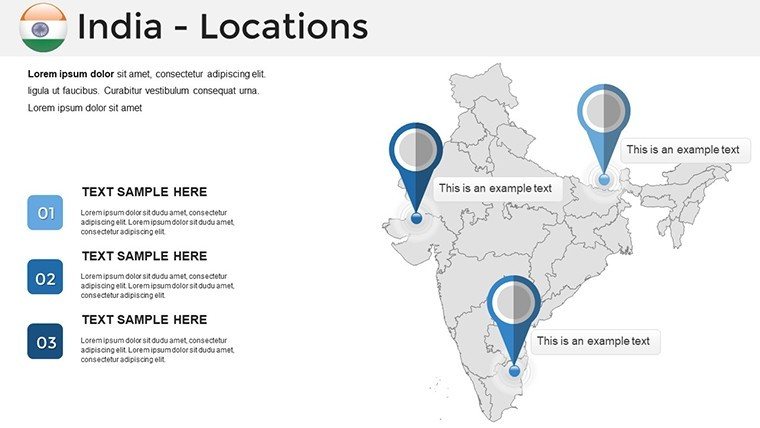
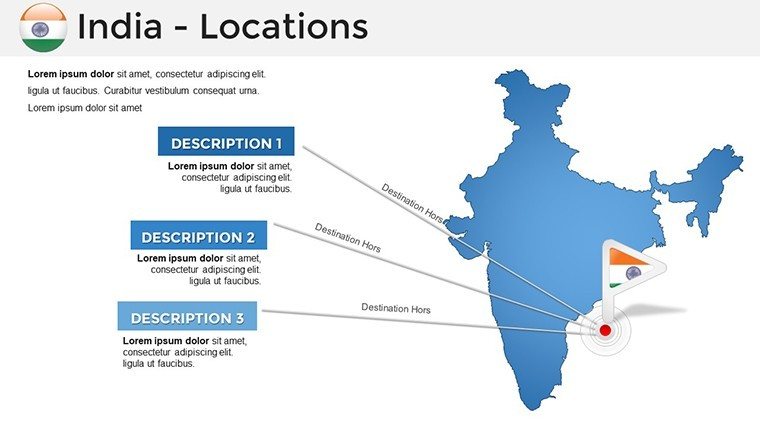
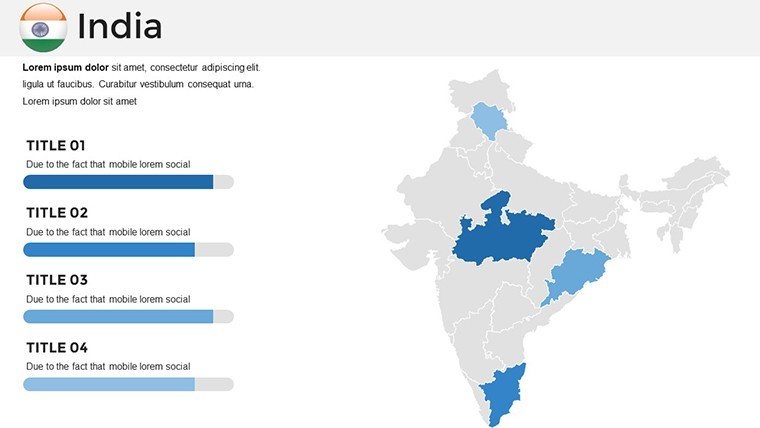
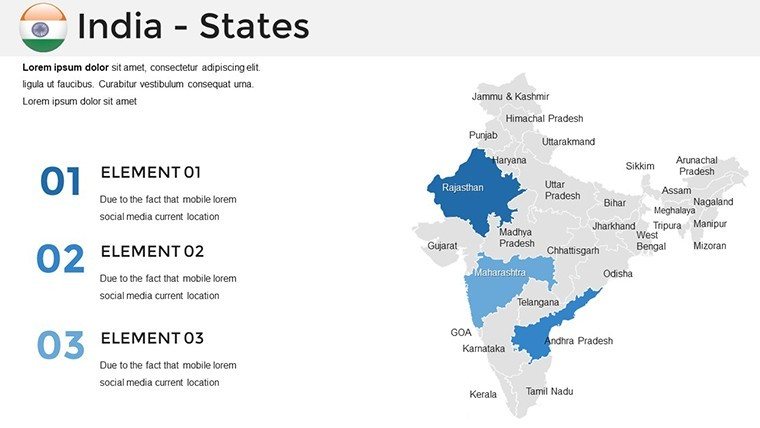
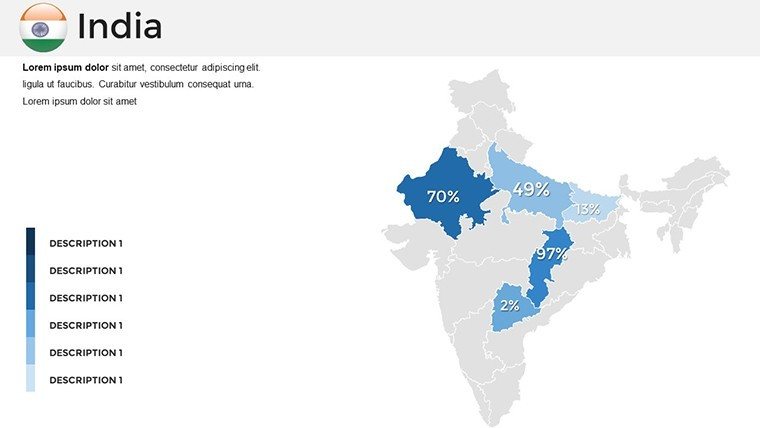
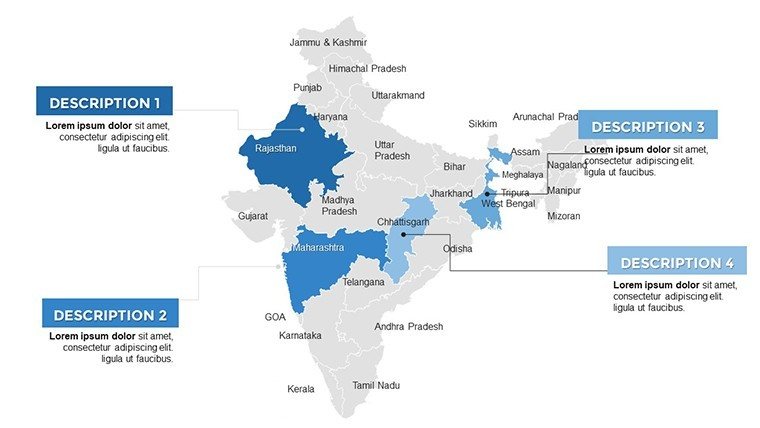
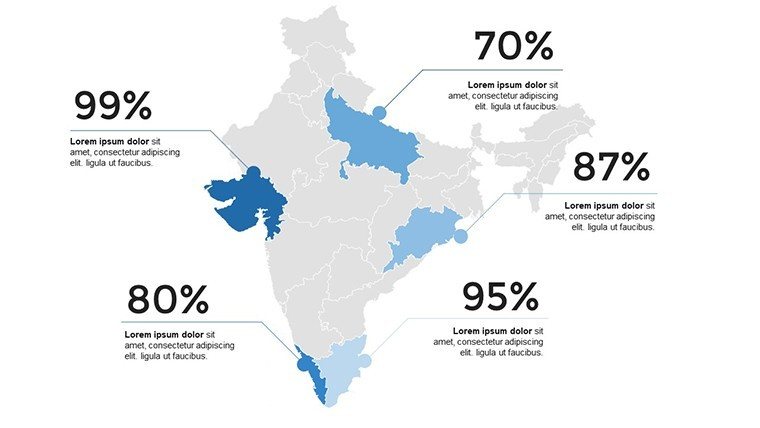
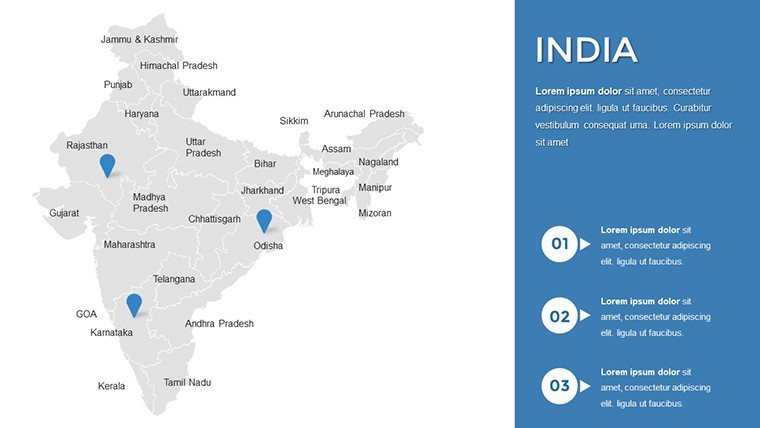
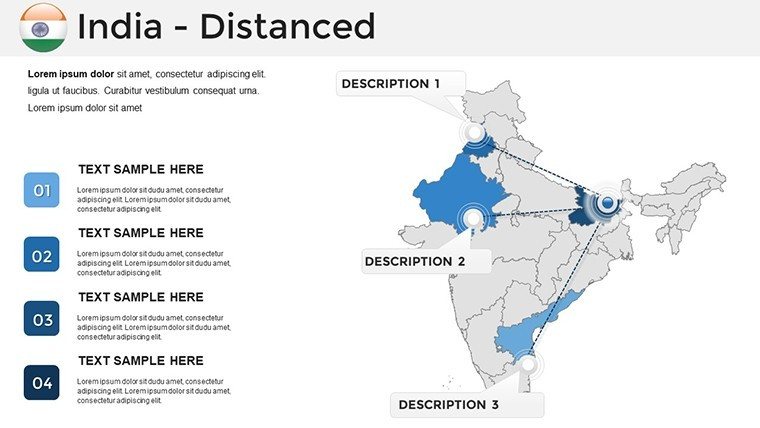
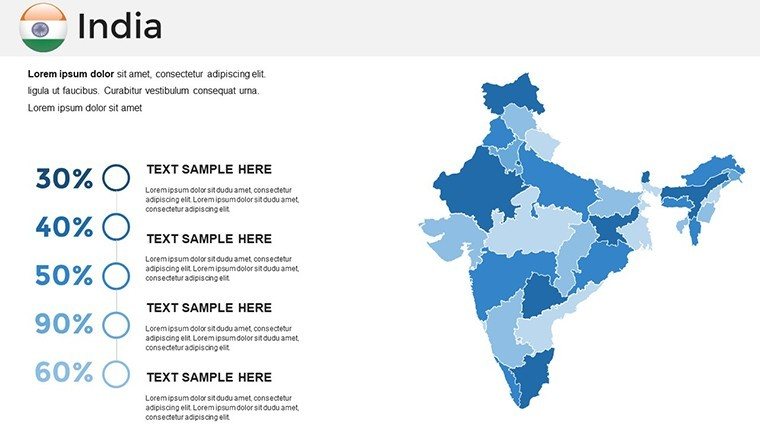
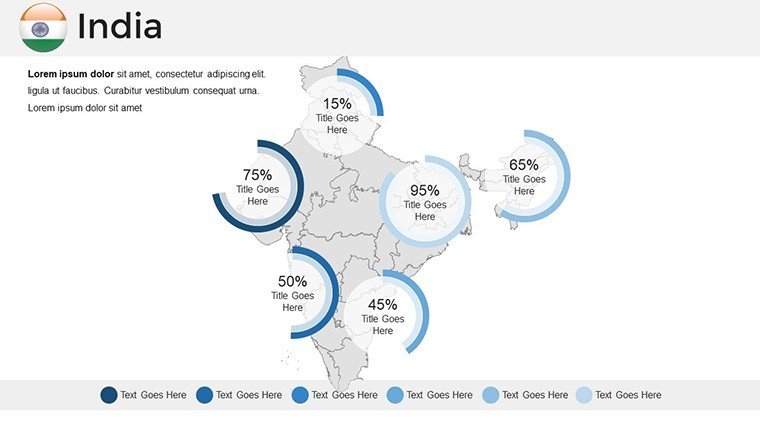
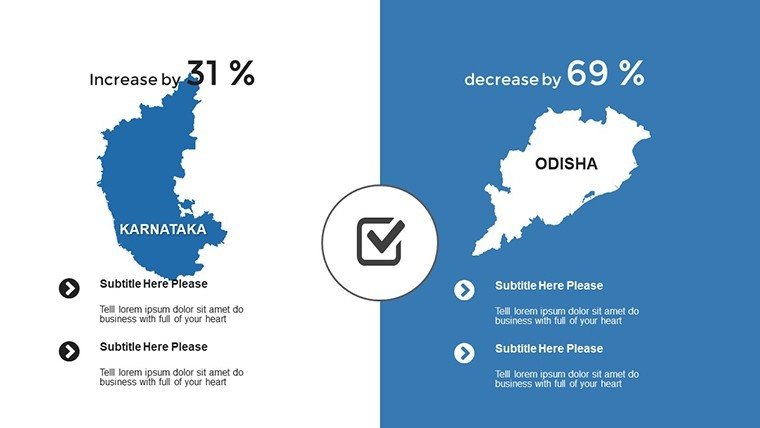
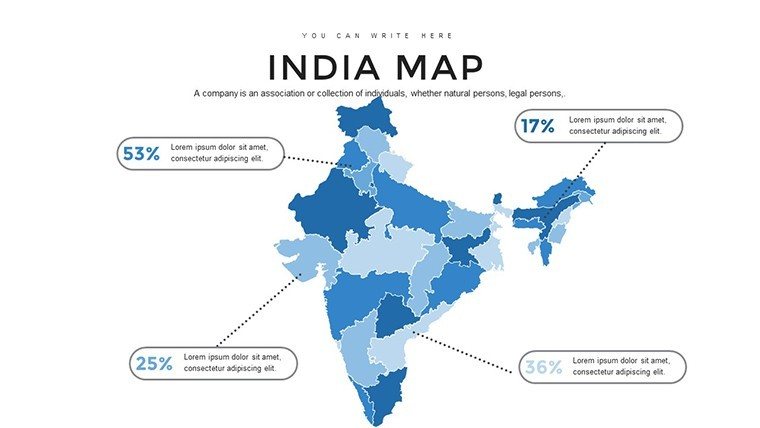
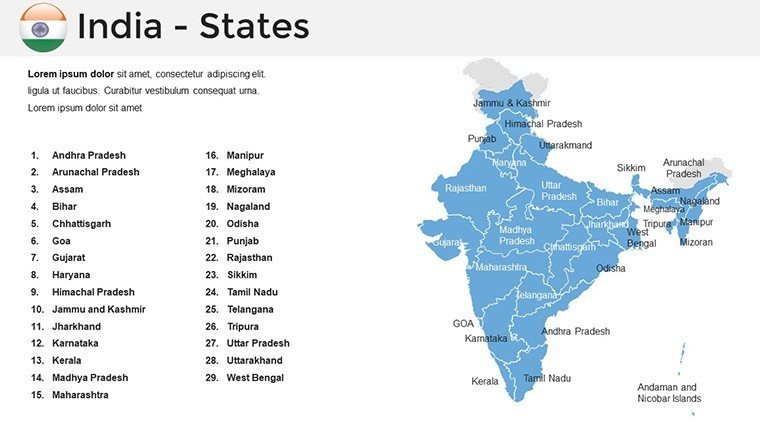
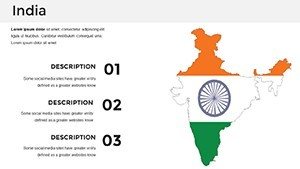
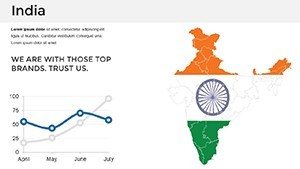
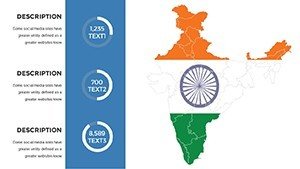
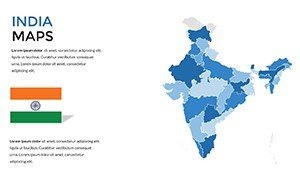
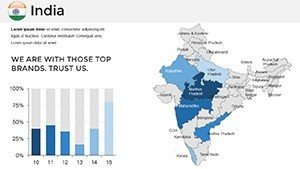
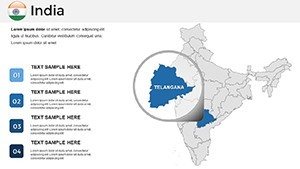
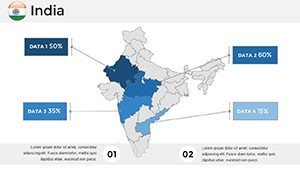
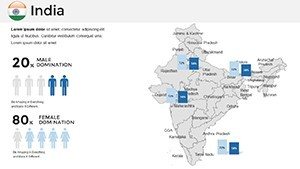
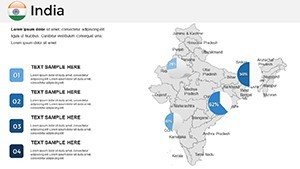
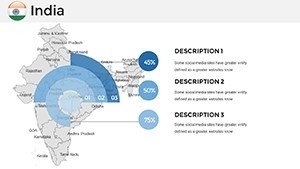
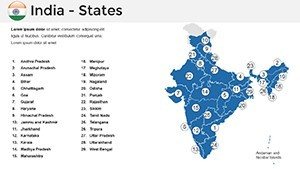
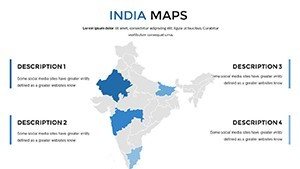
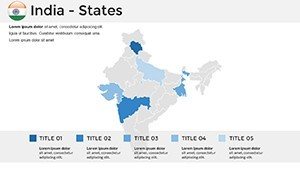
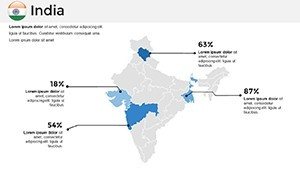
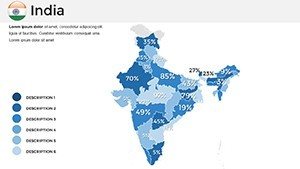
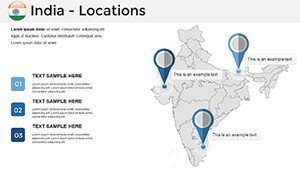
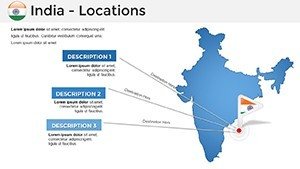
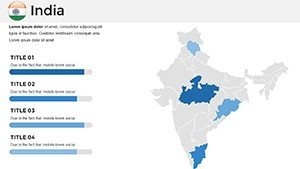
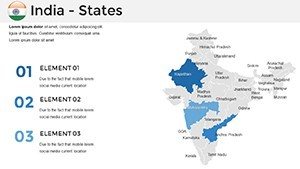
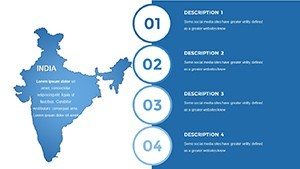
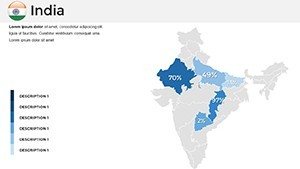
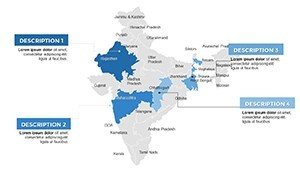
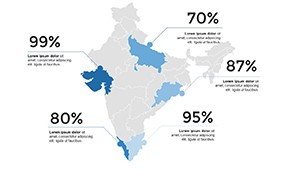
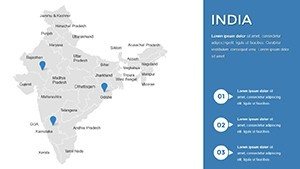
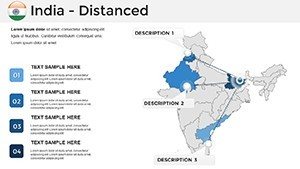
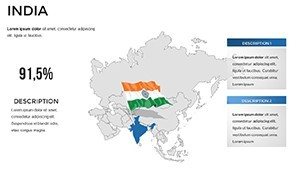
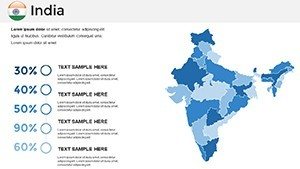
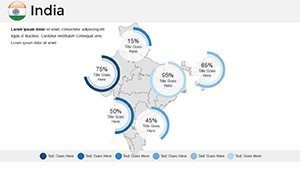
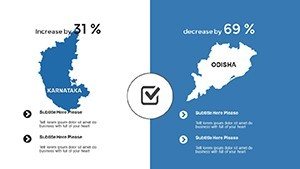
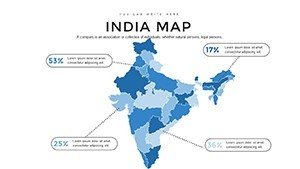
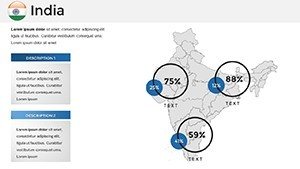
High-resolution maps form the backbone, scalable without loss of detail for any display. Kickstart with Slide 1's national overview, labeling all 28 states and 8 union territories for a holistic view. Slides 2-12 offer state-focused deep dives, where you can add markers for landmarks like the Taj Mahal in Uttar Pradesh or tech hubs in Bangalore. Thematic slides (13-24) allow for creative expressions, such as heat maps showing population growth in Bihar versus low-density Arunachal Pradesh. Wrapping up, Slides 25-36 provide blanks and hybrids for personalized touches, like overlaying tourism routes from Rajasthan's deserts to Goa's beaches. Superior to default PowerPoint options, which often lack cultural nuance, this ensures authenticity. Seamlessly import CSV data for instant visualizations, turning stats into stories that drive decisions.
In-Depth Slide Analysis: Layers of Customization
The progression is intuitive: Foundational slides for basics, mid-tier for specifics - like editing boundaries to highlight disputed areas sensitively. Advanced sections include economic zoning, perfect for showing SEZs in Gujarat. Tips: Use gradients for elevation maps to depict the Deccan Plateau, and animations to simulate monsoon patterns across the subcontinent.
Versatile Applications: Empowering Users Across Fields
Travel agencies can map itineraries, spotlighting festivals in West Bengal or wildlife in Madhya Pradesh's reserves. Researchers tackle socio-economic topics, visualizing literacy rates in Kerala versus challenges in rural Jharkhand. Businesses strategize with supply chain overviews, from textile mills in Tamil Nadu to pharma in Hyderabad. Educators engage students with interactive history lessons on independence movements. Unlike static images, this dynamic template fosters interaction, with editable notes for annotations. Real case: A NGO used it to present water conservation in arid Rajasthan, influencing policy at events like the India Water Week. Integration tips: Link to external docs for deeper dives, or collaborate in real-time via Google Slides.
Expert Strategies for Engagement
- Balance visuals: Avoid overload by focusing on 3-5 key data points per slide.
- Cultural alignment: Choose colors that evoke India's palette - saffron for heritage, green for growth.
- Accessibility first: Add descriptive text for screen readers.
- Hybrid use: Merge with infographic templates for multifaceted decks.
- Feedback loop: Iterate based on audience reactions for refined outputs.
These practices solve typical issues, like mismatched scales, for seamless, professional results.
Distinctive Edge: Built on Trust and Innovation
Inspired by geospatial leaders like ISRO, it offers comprehensive coverage that outshines competitors. Accuracy builds trust, crucial for sensitive topics like regional development. Urban planners might use it for smart city proposals in Pune, per URDPFI guidelines. It sparks innovation, turning presentations into dialogues. Eager to explore India's potential? Grab the template and innovate now.
This template unlocks doors to clearer communication, celebrating India's complexity while simplifying your workflow. Step up your game - download and discover.
Frequently Asked Questions
- How do I customize state boundaries?
- Simply select and edit shapes using PowerPoint's tools for precise adjustments.
- Does it include union territories?
- Yes, all eight are covered with detailed labels and edit options.
- Compatible with Mac versions?
- Fully, across PowerPoint for Mac and Google Slides.
- Can I add population data?
- Easily, via integrated charts or text overlays.
- Are updates available for boundary changes?
- Support provides guidance for manual updates as needed.