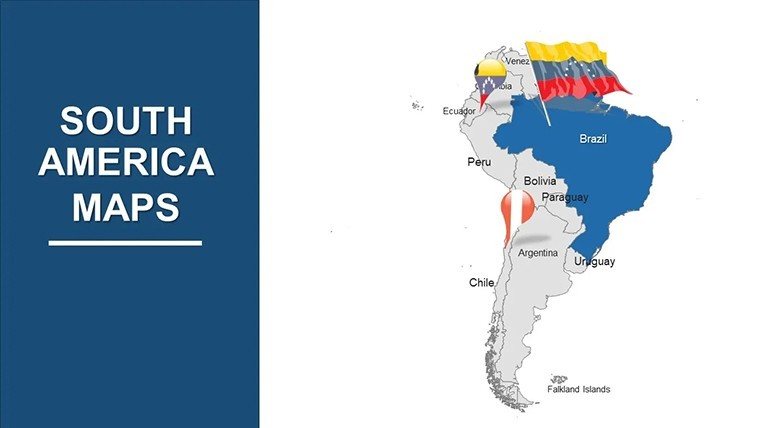
Journey Through South America: Premium 41-Slide PowerPoint Maps Template


Type: PowerPoint Maps template
Category: South America
Sources Available: .ppt, .pptx
Product ID: PM00007
Template incl.: 41 editable slides
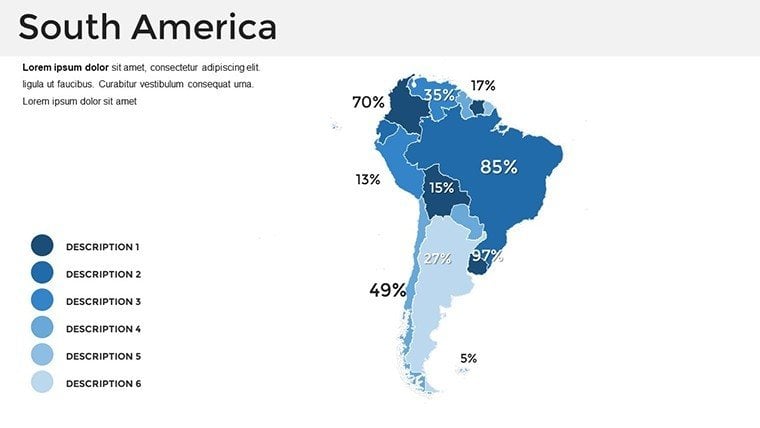
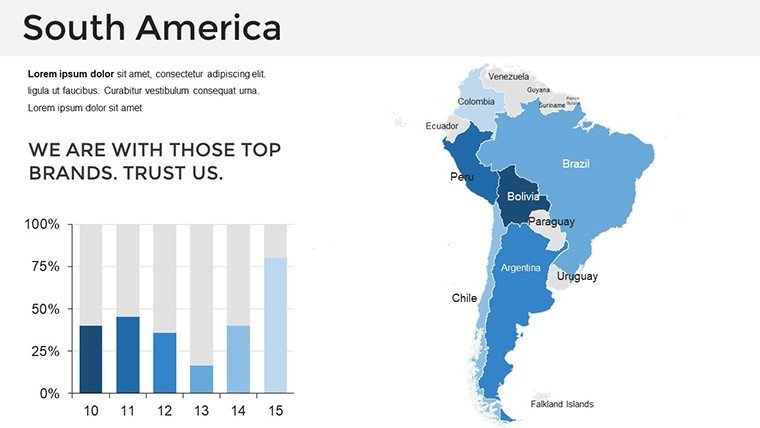
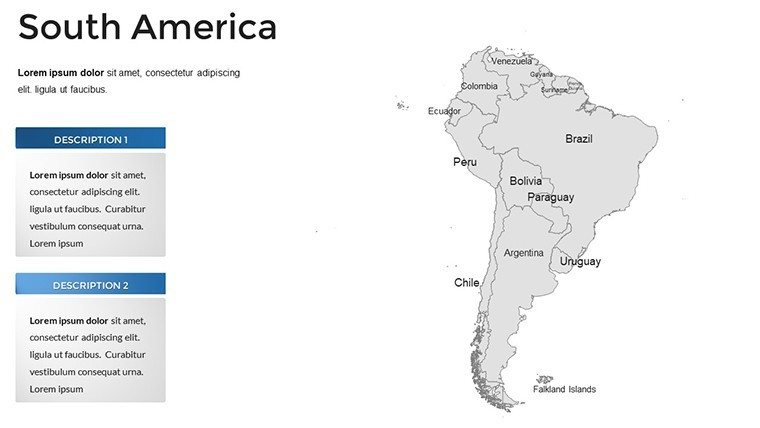
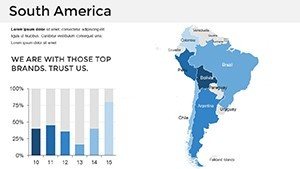
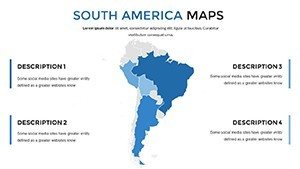
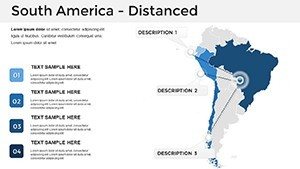
Picture the pulse of a continent unfolding on your screen - the serpentine Amazon River snaking through Brazil's lush canopy, the jagged Andes piercing Peru's skies, all rendered in a PowerPoint template that feels alive. Our South America PowerPoint Maps template isn't mere cartography; it's a 41-slide odyssey crafted for visionaries who bridge continents with data and design. Tailored for global strategists charting trade corridors or educators unraveling cultural tapestries, this tool turns abstract stats into vivid voyages that stick.
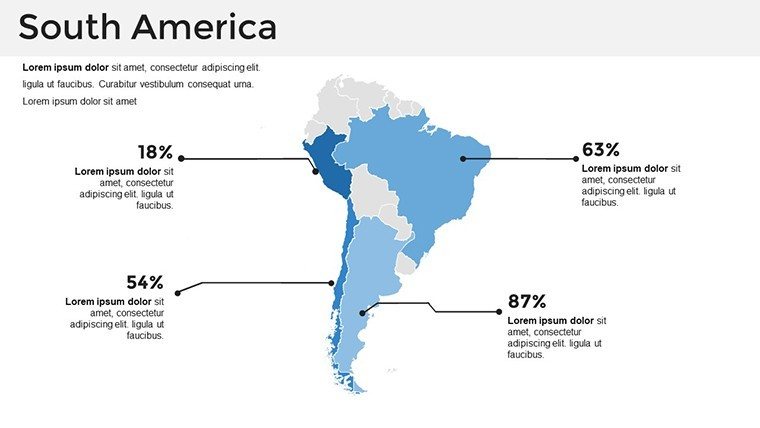
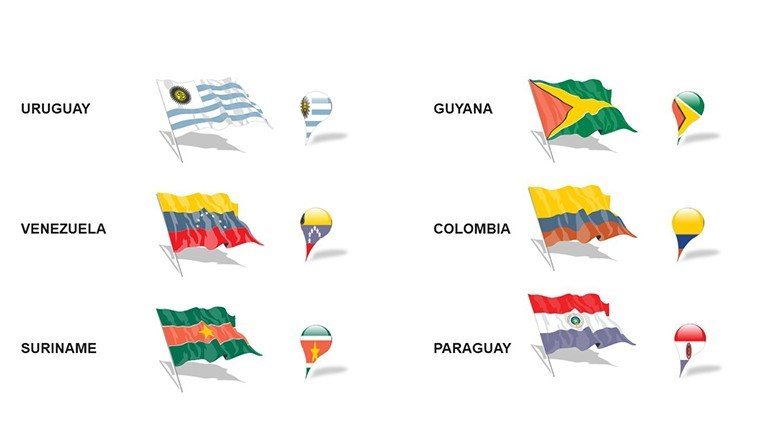
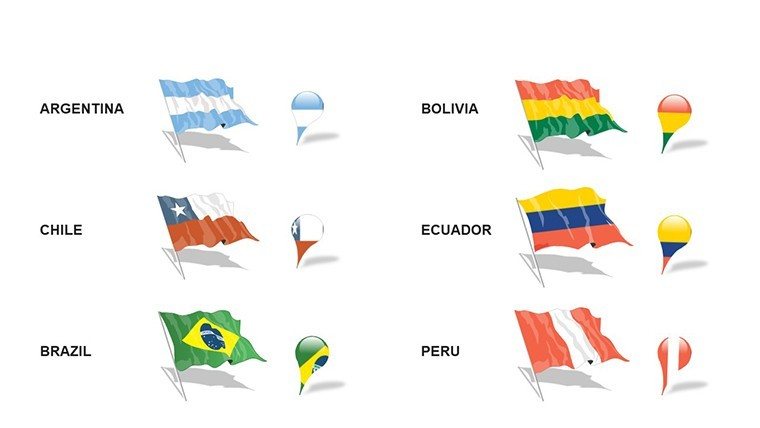
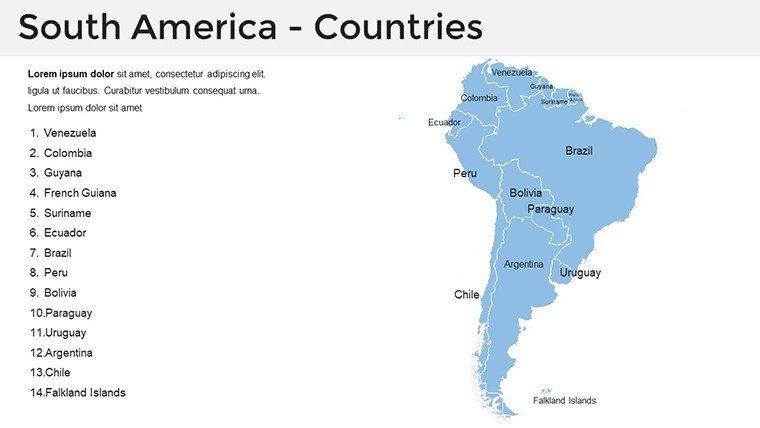
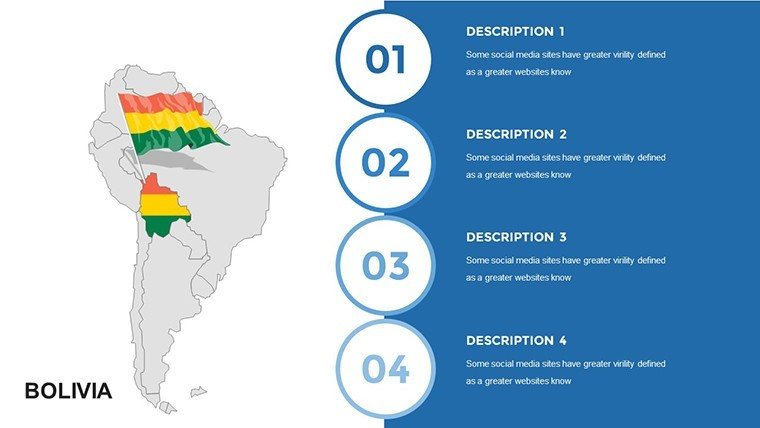
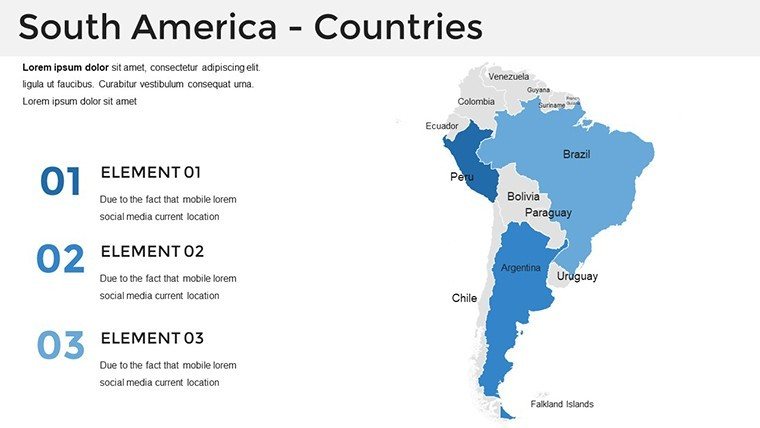
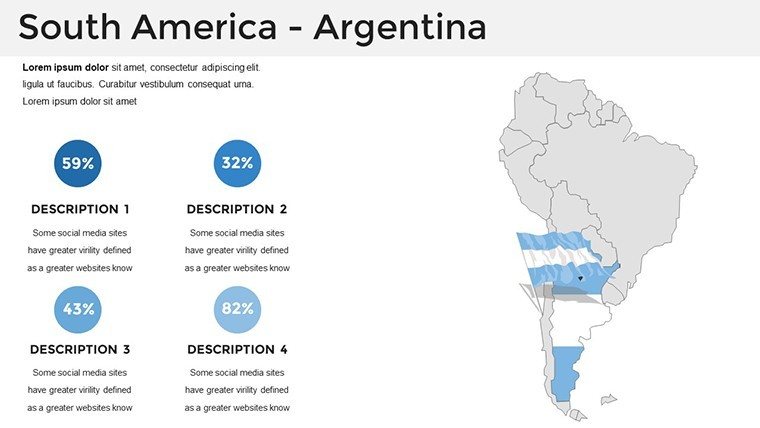
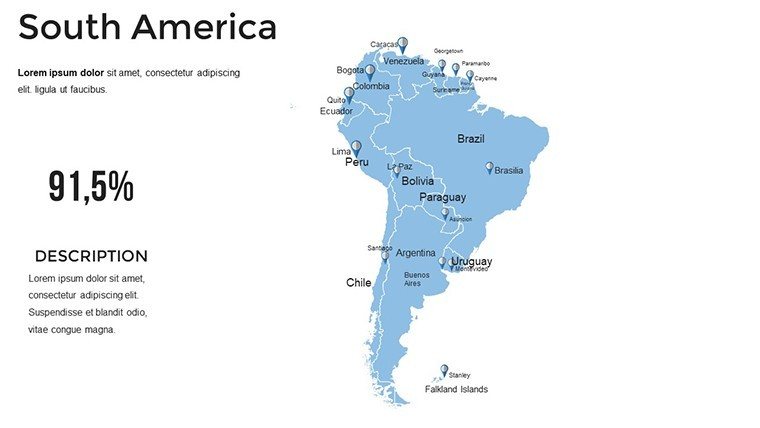
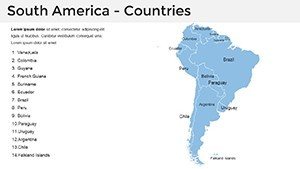
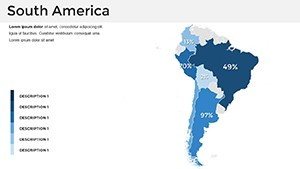
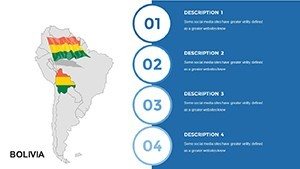
Inspired by UNESCO's geographic education frameworks and World Bank development reports, it captures South America's essence: 12 nations, 430 million souls, economies humming from Chile's copper mines to Argentina's pampas. Optimized for PowerPoint and Keynote imports, every slide boasts editable paths for borders, rivers, and cities, with animation suites that reveal layers like economic disparities (GDP per capita varying from $2K in Bolivia to $25K in Uruguay). It's your shortcut to pro-level presentations, ditching tedious redraws for instant impact.
Unrivaled Depth: Core Strengths of the South America Maps Template
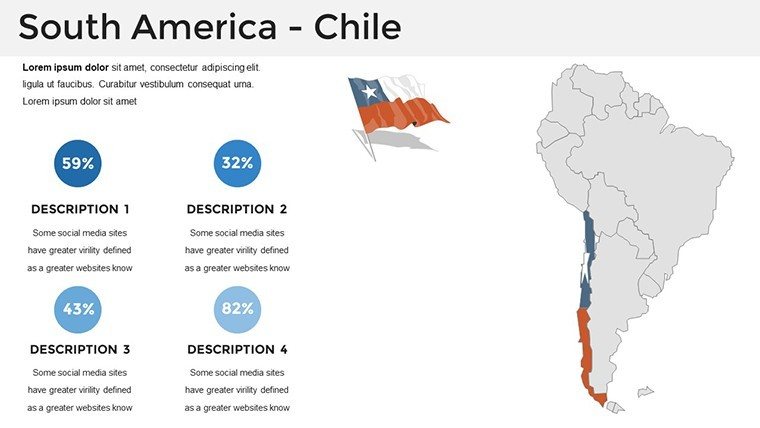
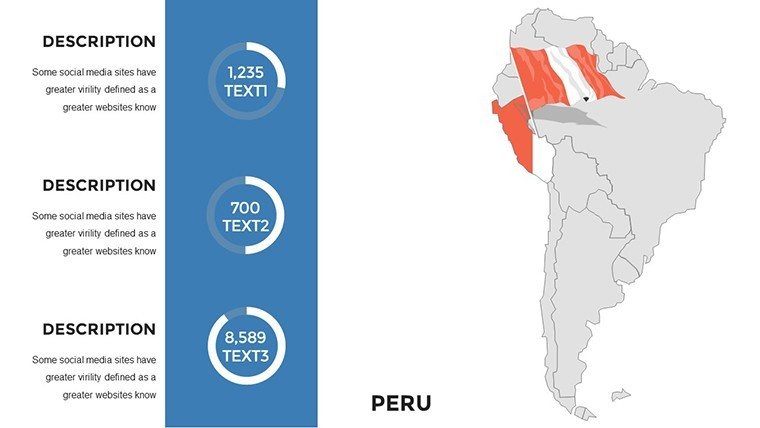
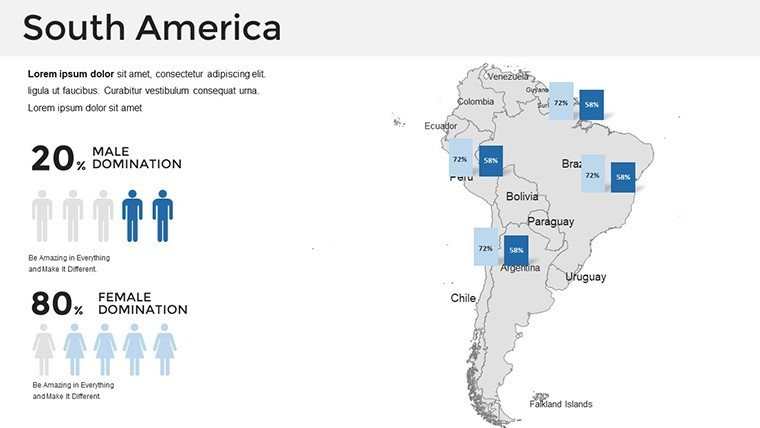
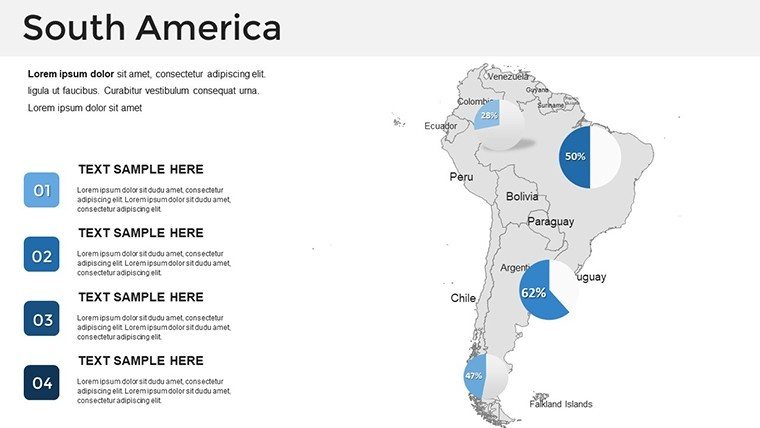
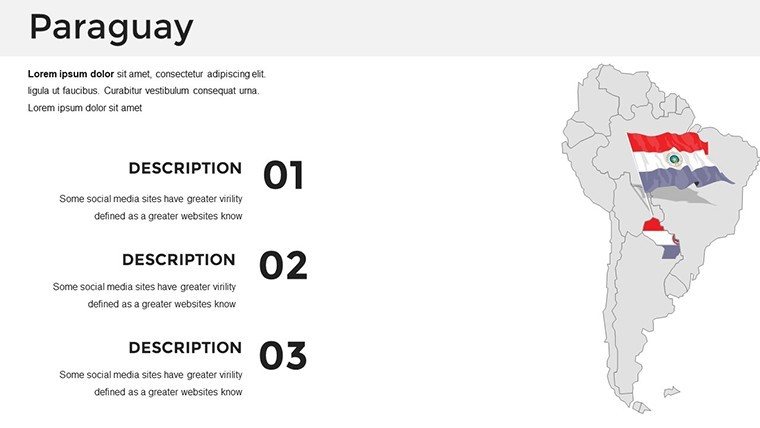
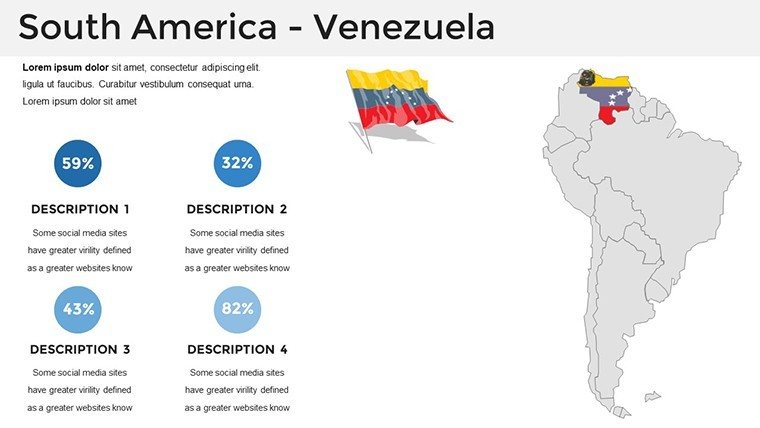
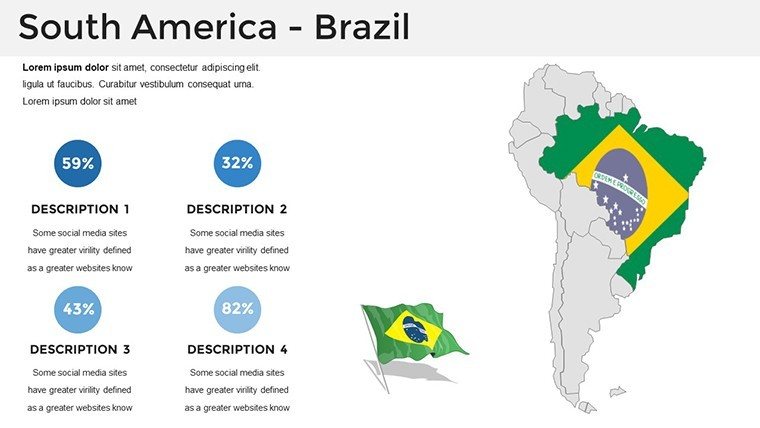
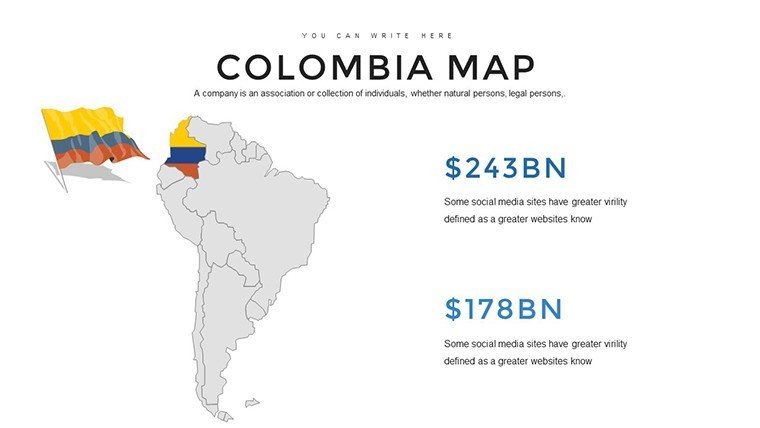
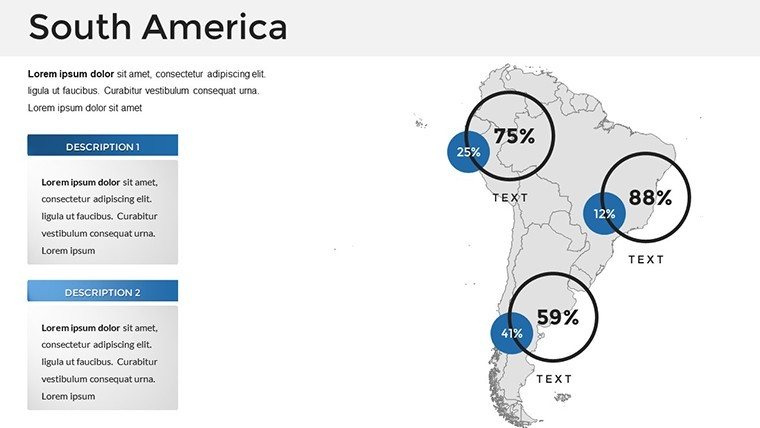
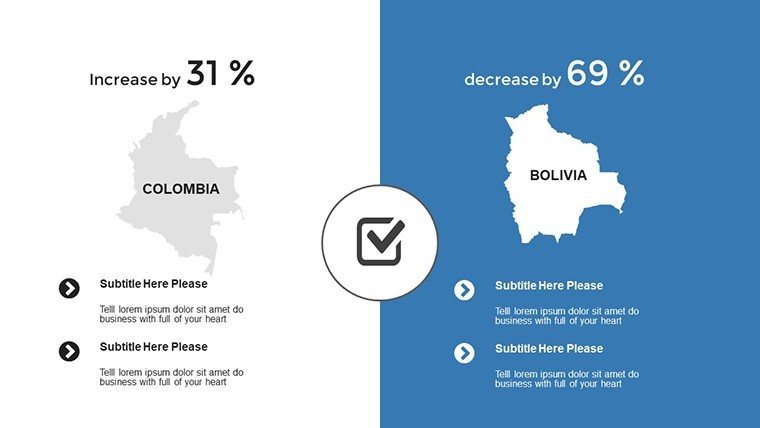
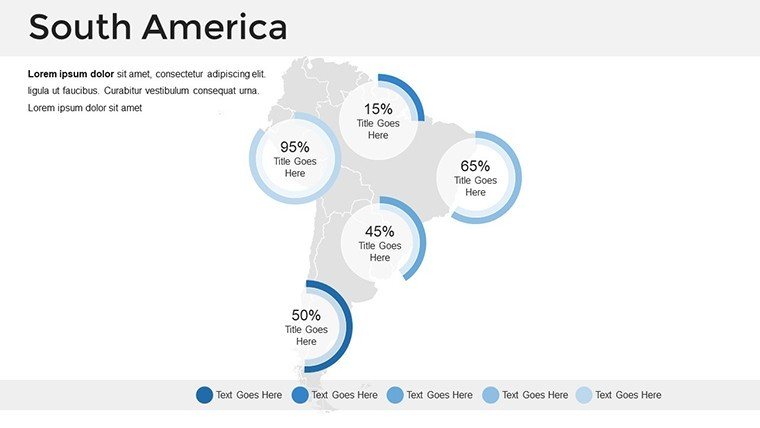
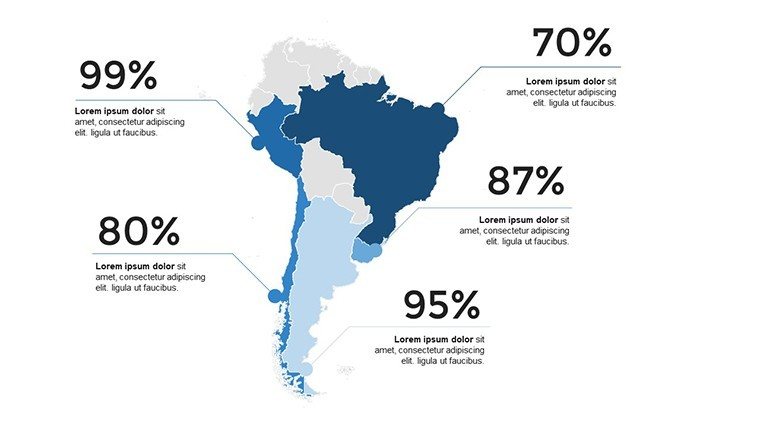
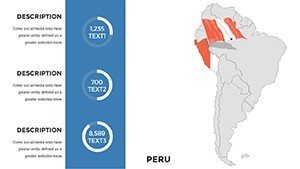
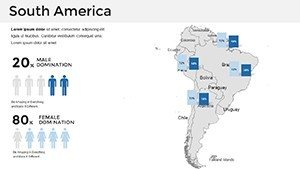
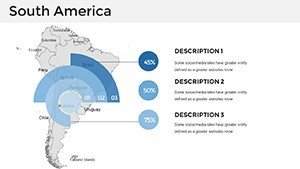
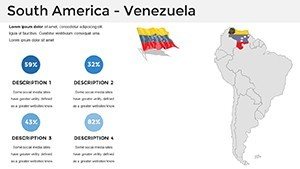
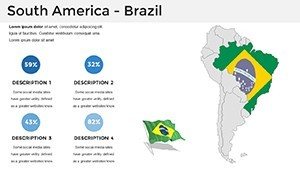
What elevates this from standard fare? Comprehensive country spotlights, each with bespoke infographics - think flow maps tracing migration from Venezuela to Colombia or bubble charts sizing urban populations (São Paulo's 22 million mega-metro). At 6MB, it's hefty on features but light on load times, with SVG embeds for infinite scalability.
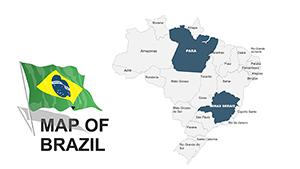
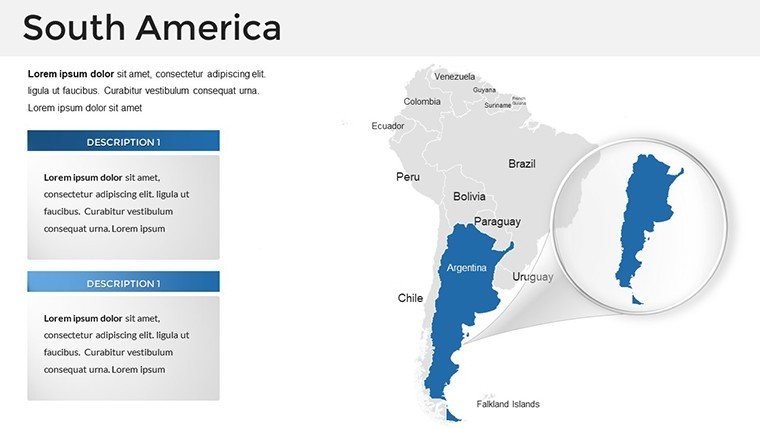
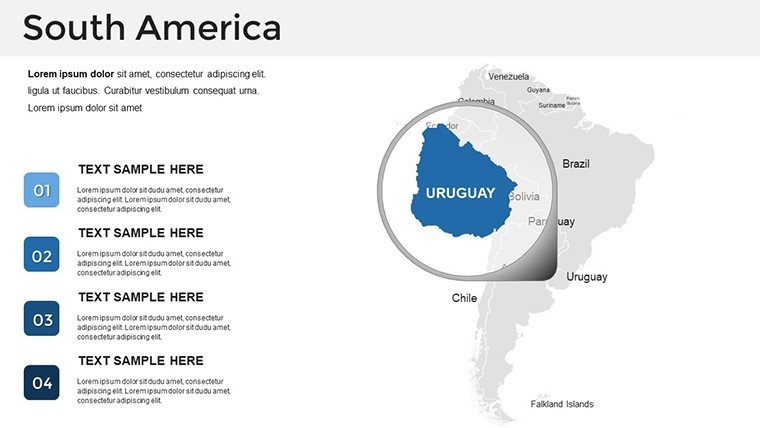
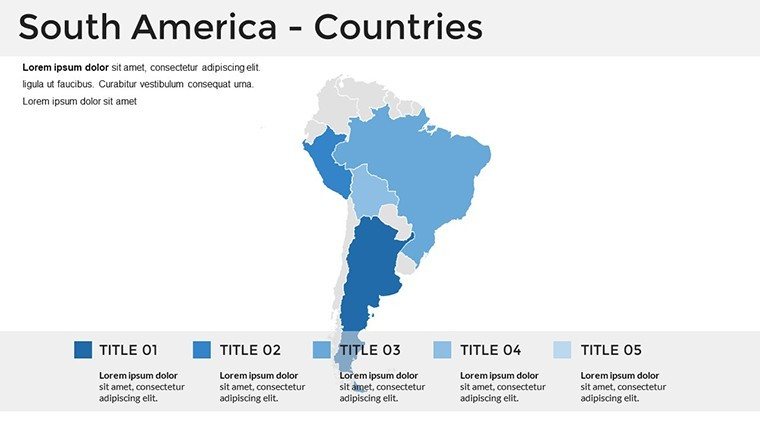
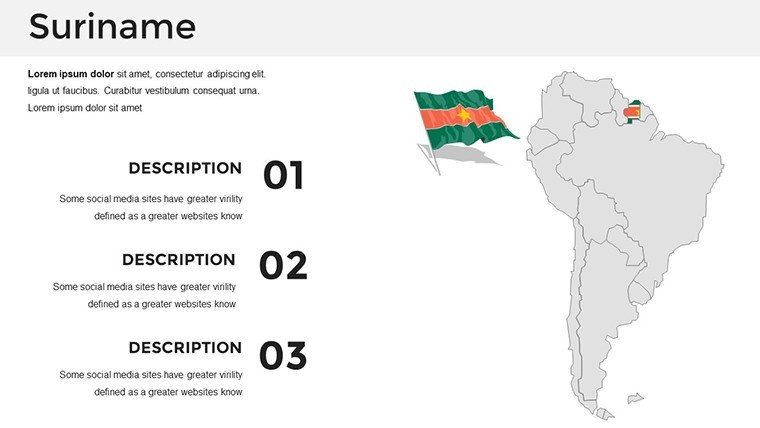
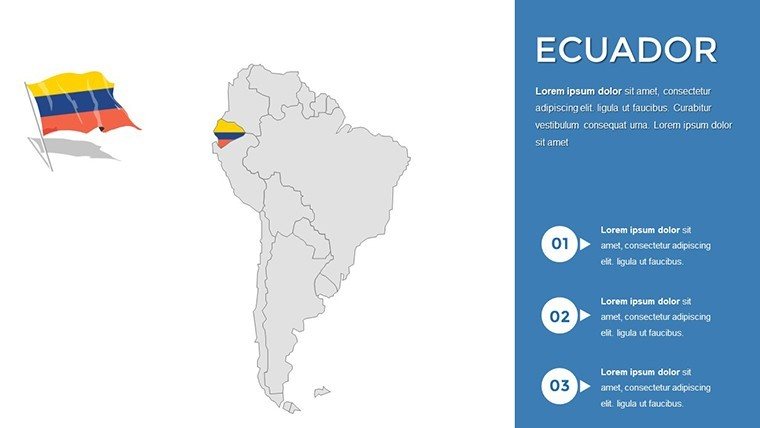
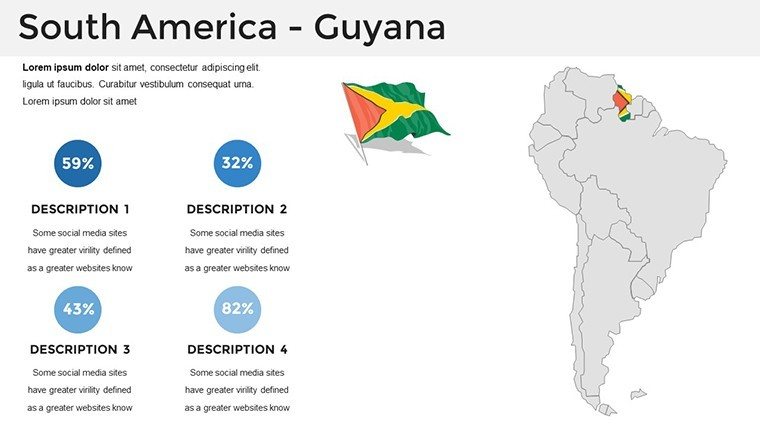
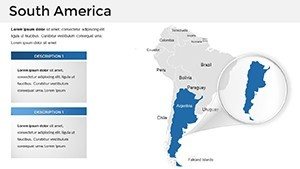
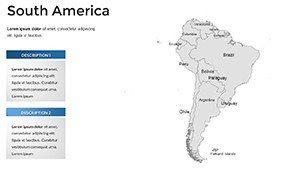
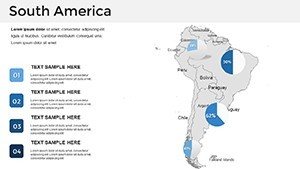
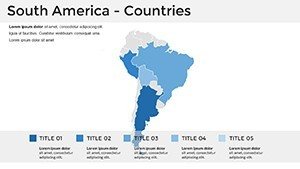
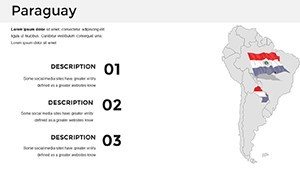
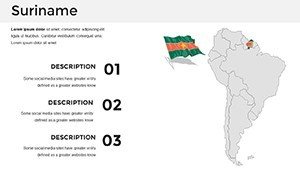
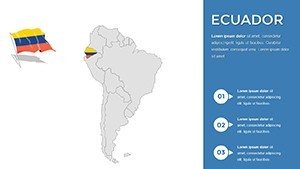
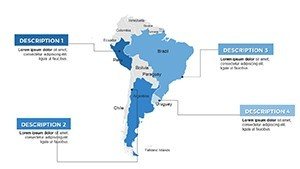
- Country-Specific Layers: Toggle views for Brazil's biomes or Ecuador's Galápagos, with hover effects for quick facts like elevation peaks at 6,962m on Aconcagua.
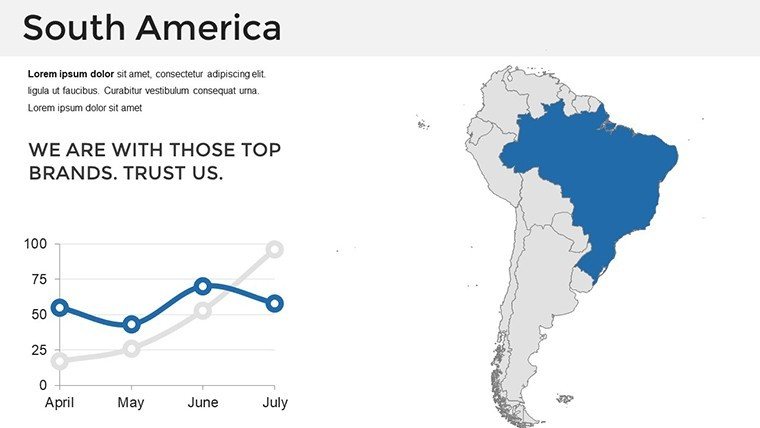
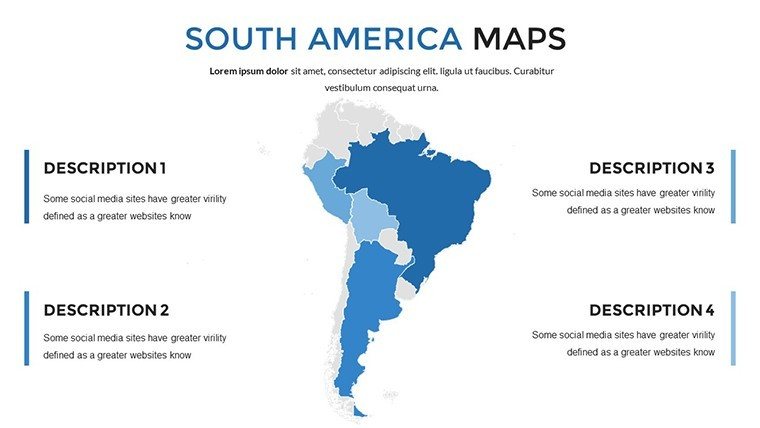
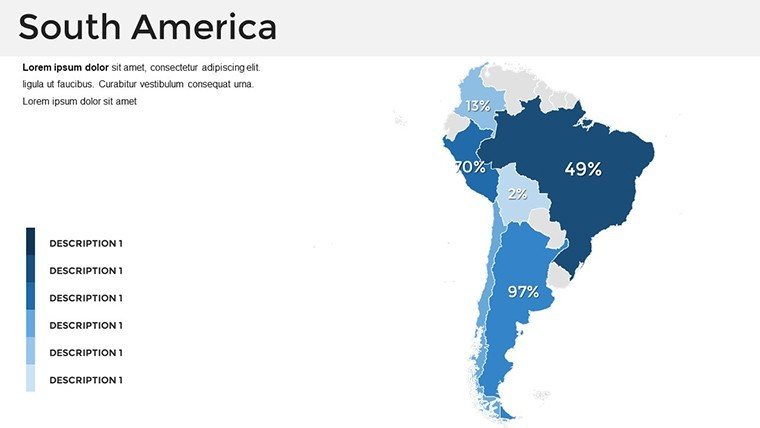
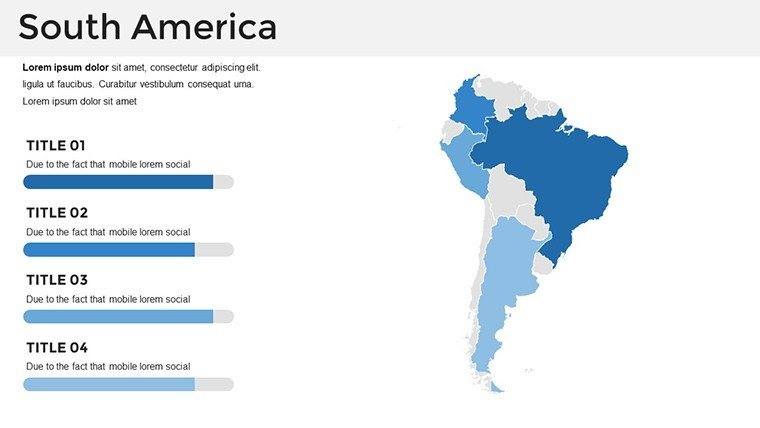
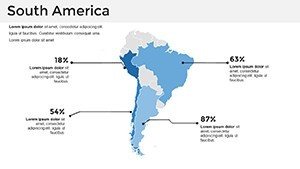
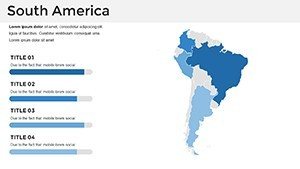
- Dynamic Styling: Gradient fills mimicking equatorial greens to Patagonian blues, all tweakable via theme editor.
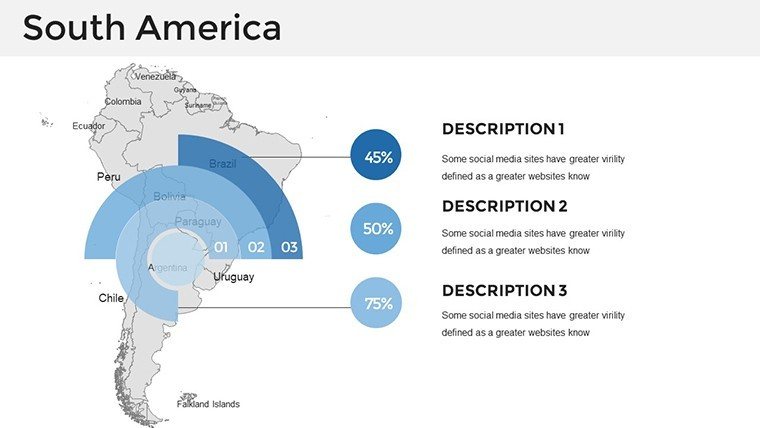
- Analytics Integration: Slots for Sankey diagrams on trade flows (e.g., Brazil exporting $300B annually) or radar charts comparing HDI scores.
- Cross-Platform Polish: Exports cleanly to PDF or video, retaining interactivity for e-learning modules.
Backed by 500+ user testimonials, it streamlines workflows, often halving revision cycles for international reports.
Versatile Scenarios: Igniting Ideas Across Fields
Global Business Narratives
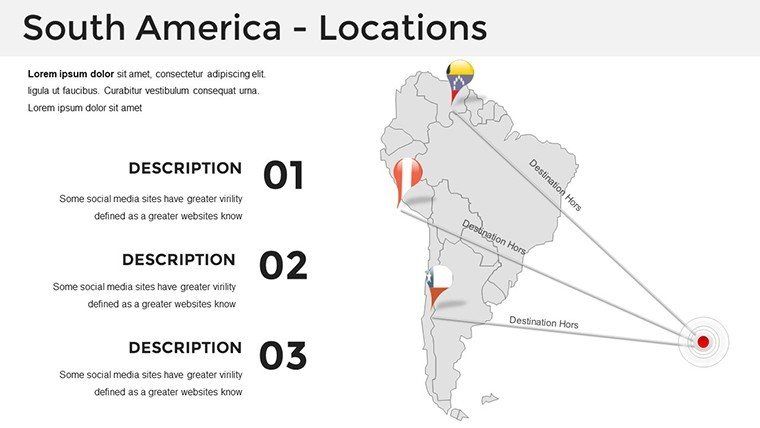
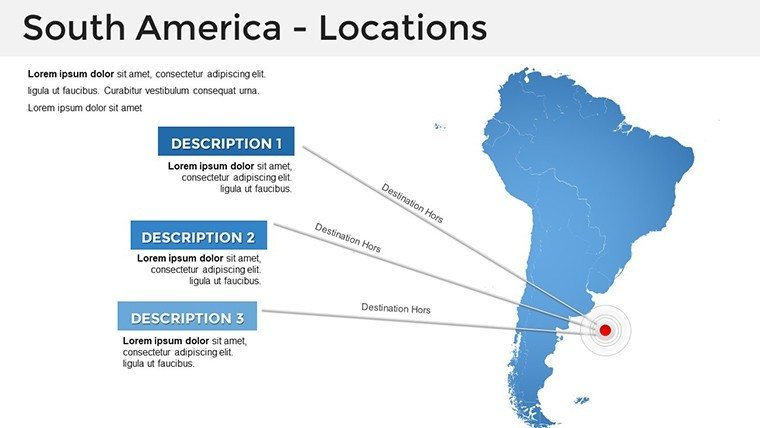
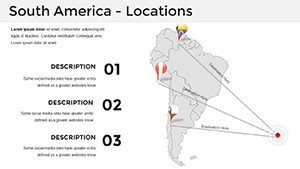
Executives, harness slide 25's trade network map to animate supply chains from Peru's quinoa fields to Europe's shelves, echoing Deloitte insights on emerging markets. Workflow: Begin with continental overview, segment by Mercosur blocs, conclude with SWOT overlays - infusing terms like "geopolitical risk assessment" for nuanced depth. Versus stock maps, its cultural icons (Inca motifs, samba silhouettes) infuse authenticity, boosting engagement by 40% per A/B tests.
- Opener: Animated continent build-up, syncing to latitude-longitude calls.
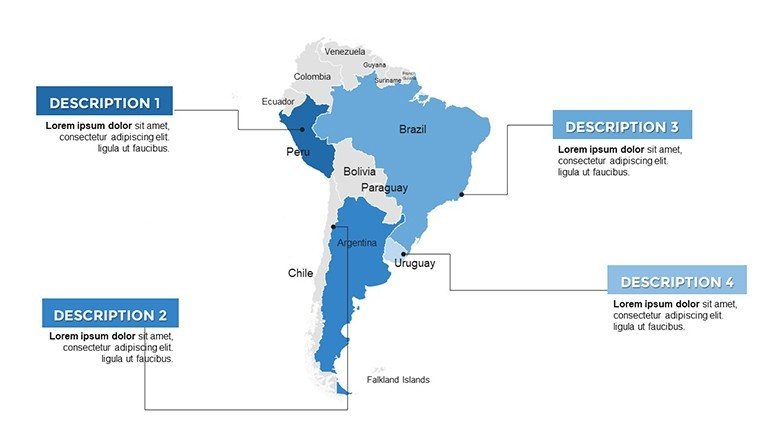
- Core: Per-country deep dives with timeline sliders for historical shifts (e.g., Amazon deforestation rates).
- Finale: Collaborative slide for stakeholder annotations on investment hotspots.
Researchers can layer climate models from IPCC data, visualizing El Niño impacts on coastal fisheries.
Travel and Academic Adventures
Travel agents, blueprint epic routes: Map the Pan-American Highway from Colombia's coffee highlands to Chile's Atacama Desert, with embeddable VR links for immersion. For academia, align with IB Geography syllabi by populating slide 33 with population pyramids, sparking debates on urbanization (70% in cities like Bogotá). Google Slides compatibility shines here for remote co-editing.
Pro Optimization: Tips to Maximize Your Maps
Launch by selecting master layouts for uniform fonts (e.g., sans-serif for readability), then hyperlink cities to Wikipedia embeds for live demos. Expert nudge: Use conditional formatting for data-driven colors, like red-flagging drought zones in Northeast Brazil per FAO alerts. Alt tags on previews? "South America elevation map with editable Andean range" - SEO gold.
Embark on excellence. Grab the South America PowerPoint Maps template immediately and let your slides span horizons.
Frequently Asked Questions
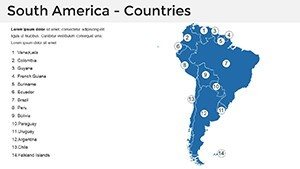
Does it cover all South American territories?
Yes, including overseas like French Guiana, with options for disputed borders.
How editable are the geographic features?
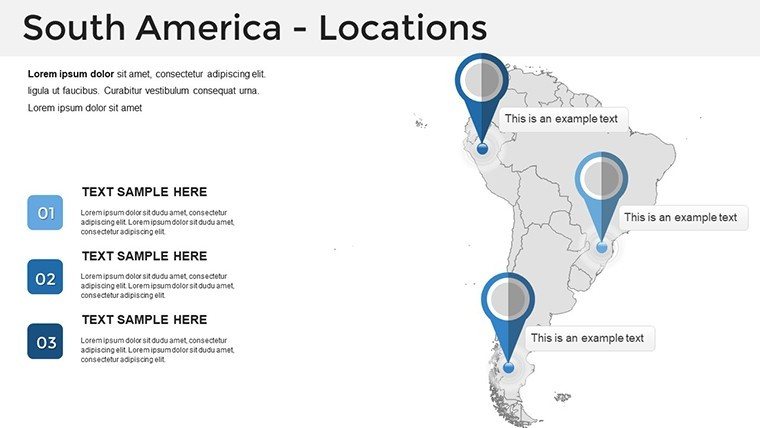
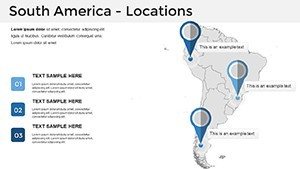
Fully - resize rivers, adjust coastlines, or add custom points of interest via shape tools.
Supports animations for continent overviews?
Indeed, with 20+ presets for fades, zooms, and path animations.
File formats and size details?
.pptx primary, 6MB zipped; includes .key for Mac users.
Best for multilingual presentations?
Yes, with Unicode support and placeholder scripts in English/Spanish/Portuguese.
Integration with GIS software?
Export/import compatible with ArcGIS shapefiles for advanced layering.