Editable France Regions PowerPoint Maps: Regional Storytelling Redefined


Type: PowerPoint Maps template
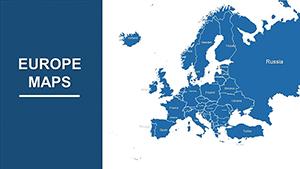
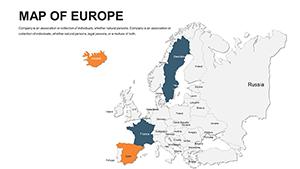
Category: Europe
Sources Available: .pptx
Product ID: PM00085
Template incl.: 48 editable slides
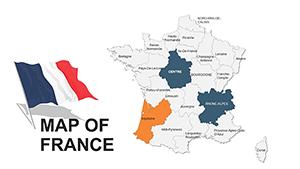
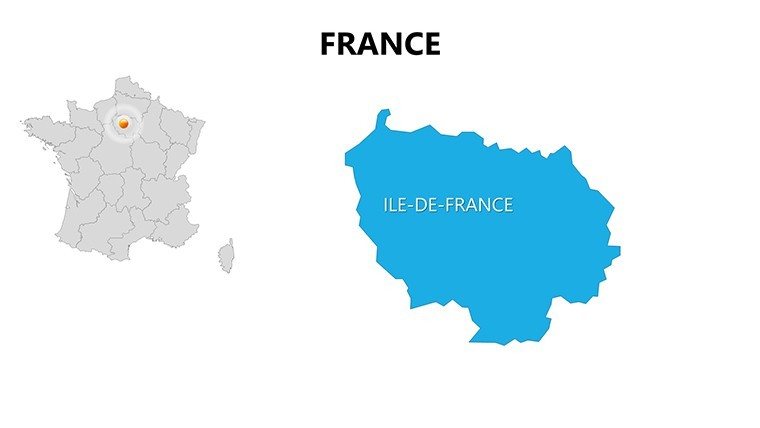
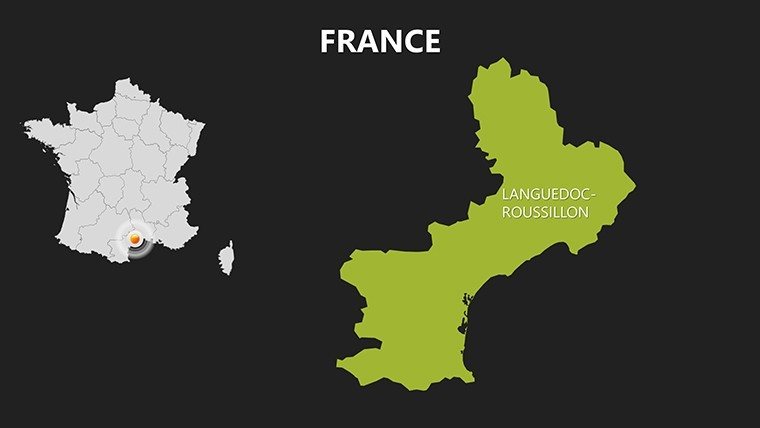
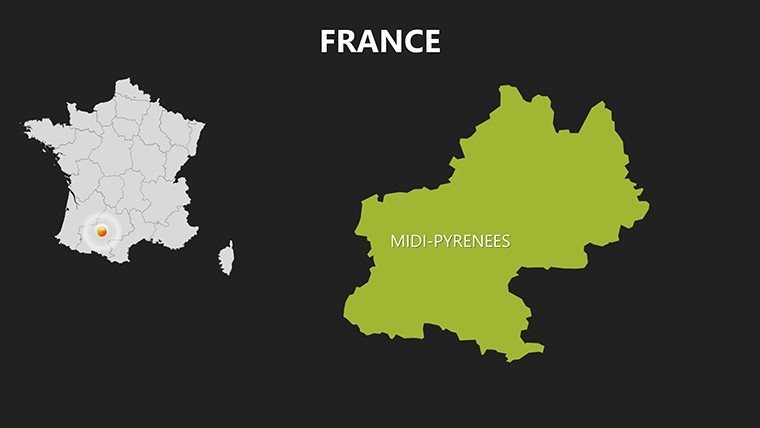
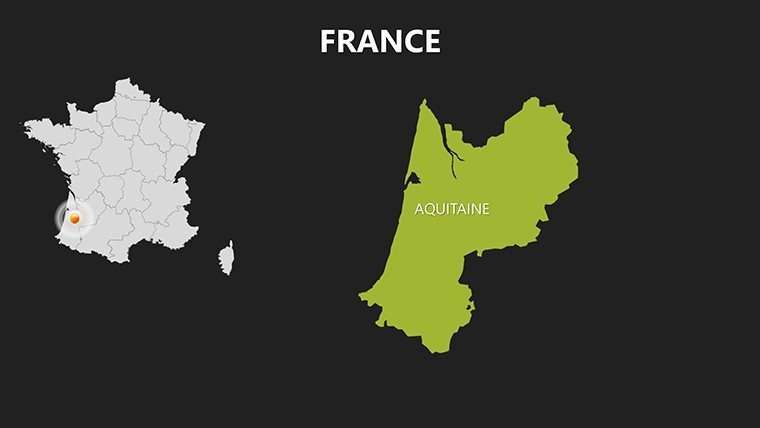
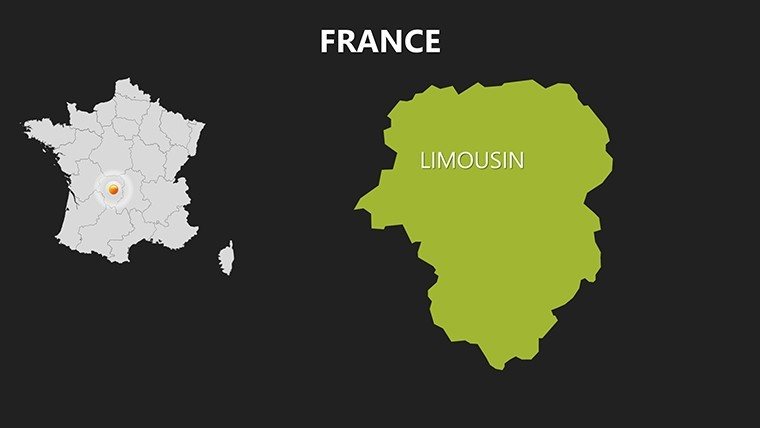
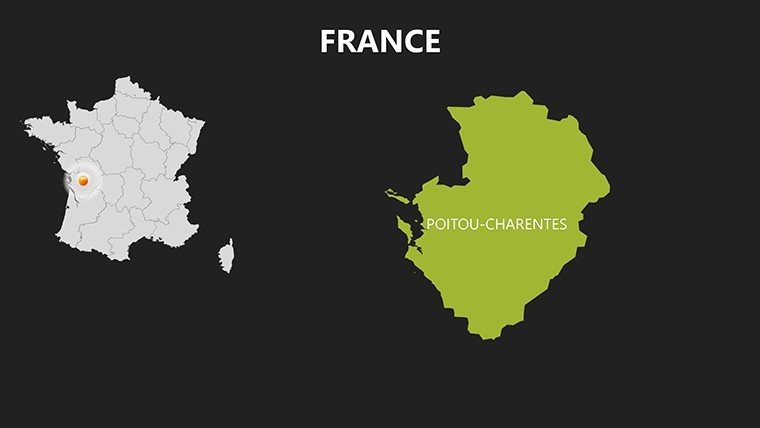
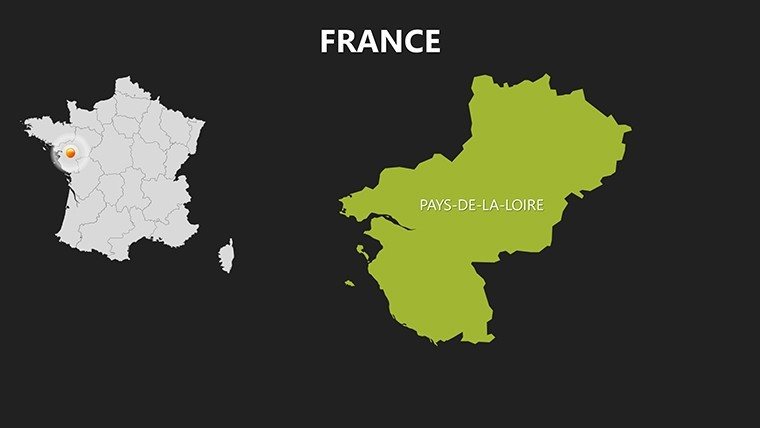
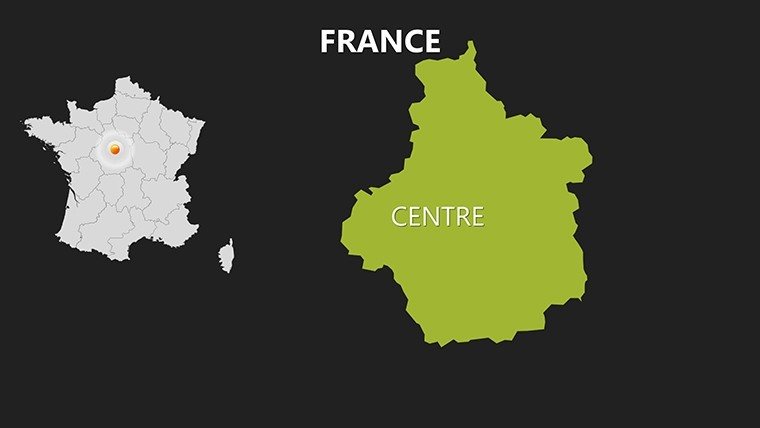
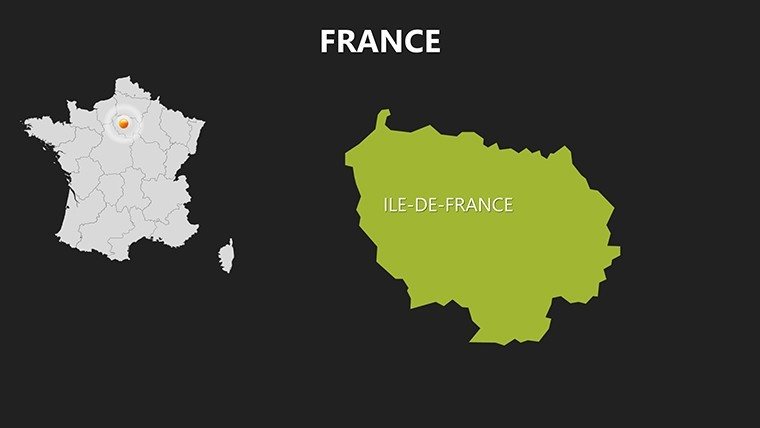
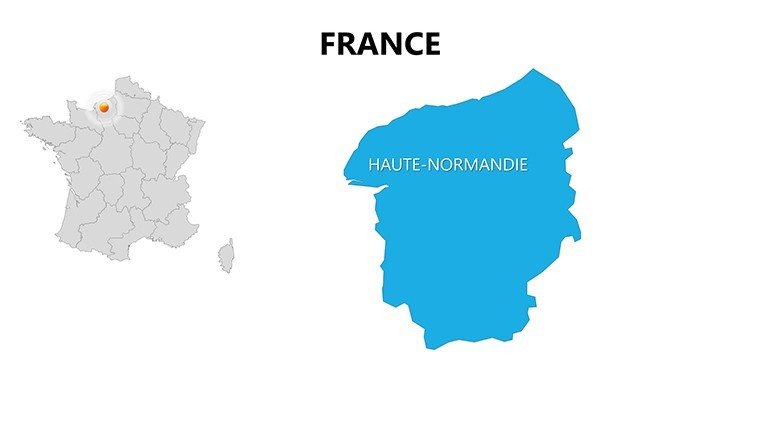
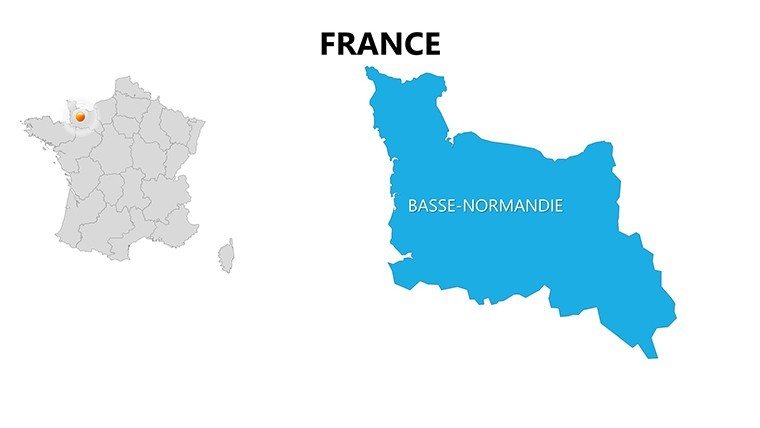
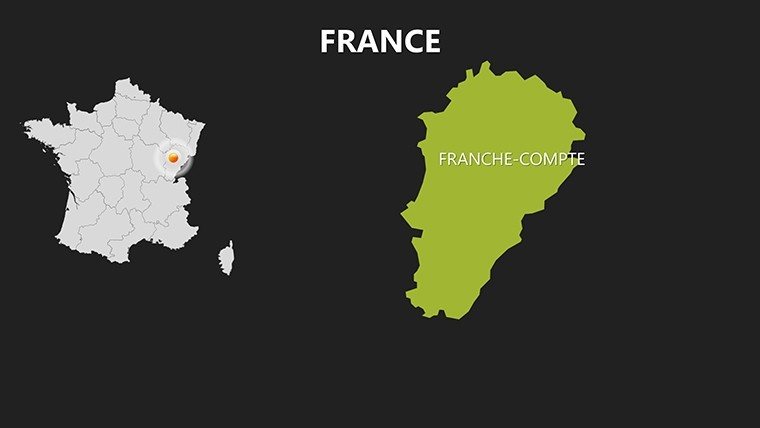
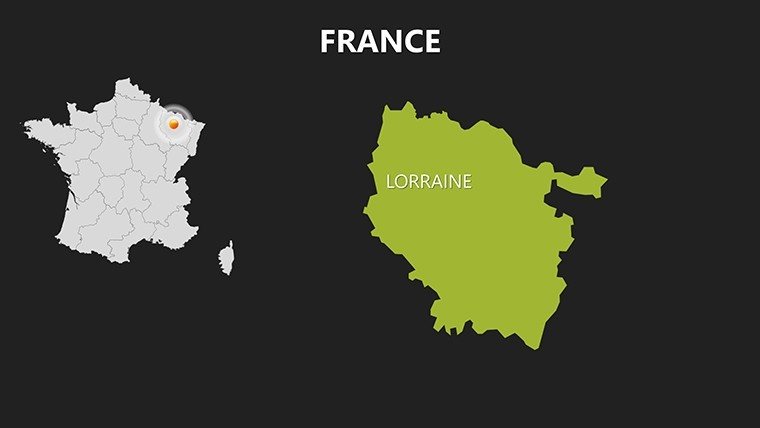
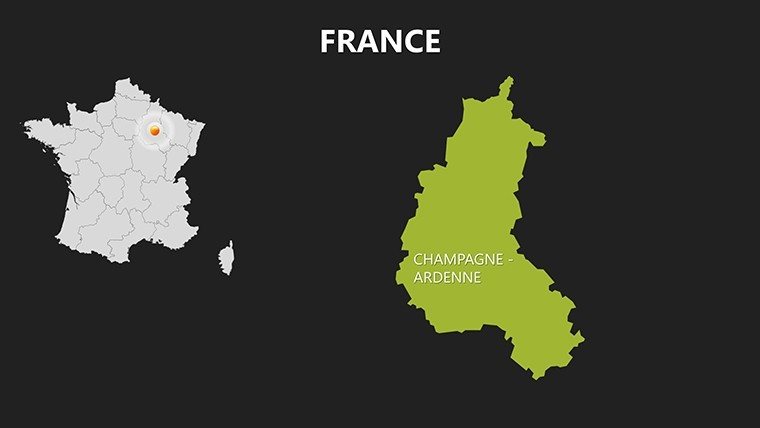
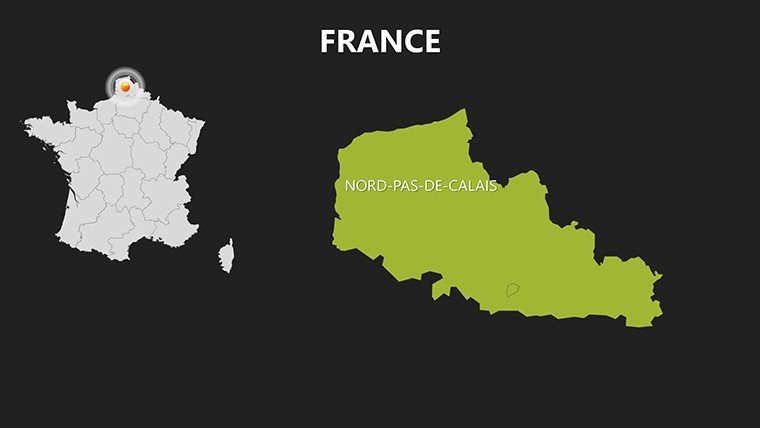
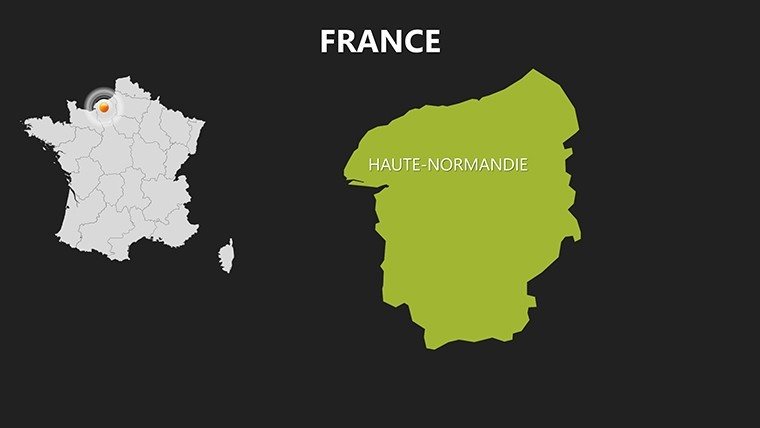
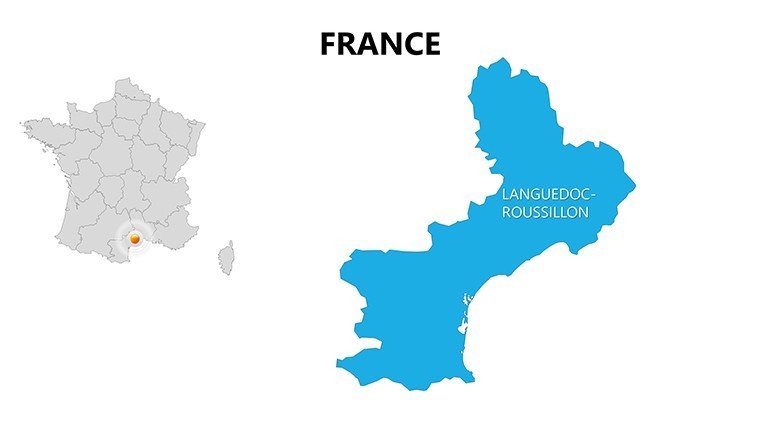
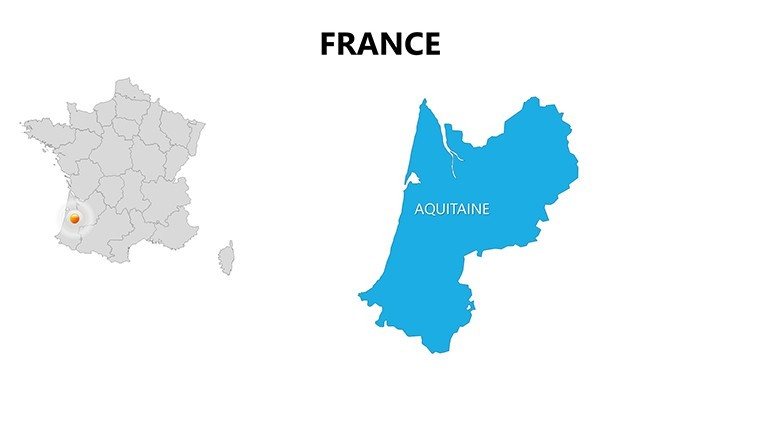
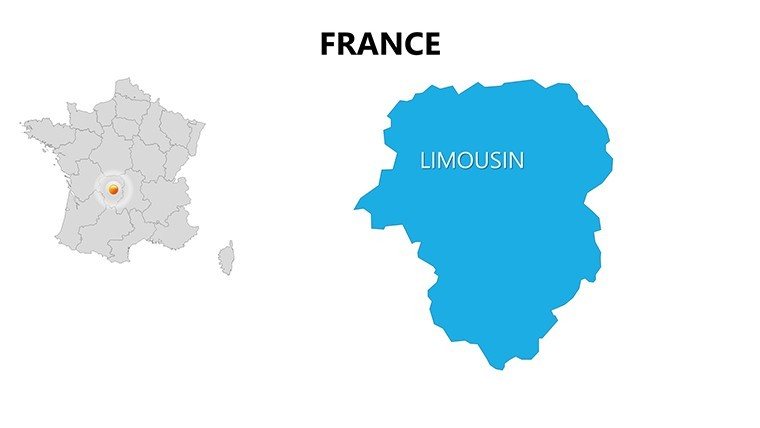
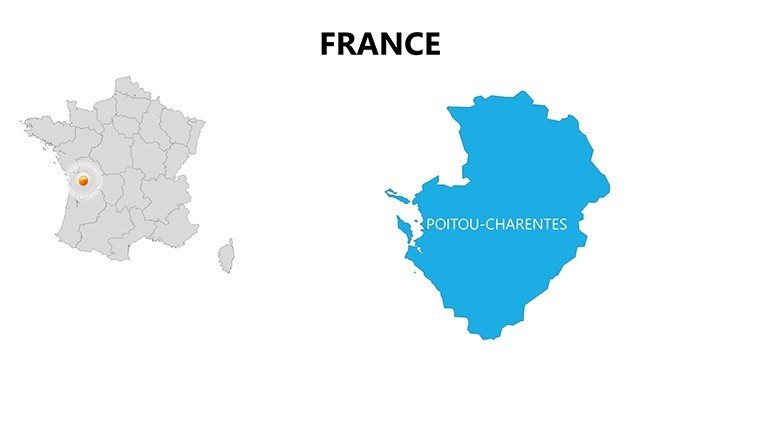
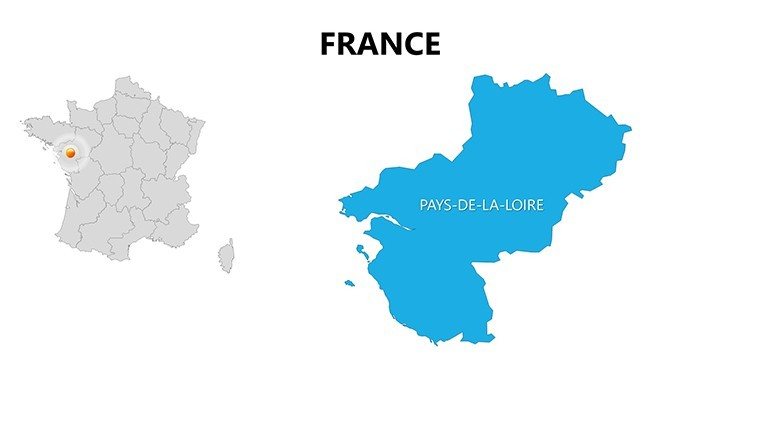
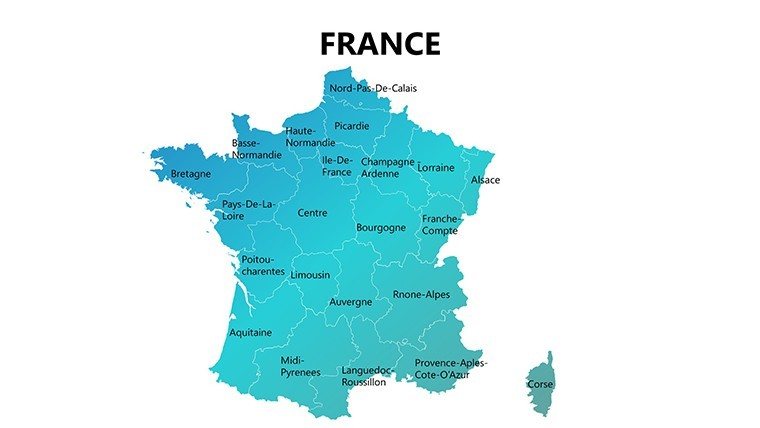
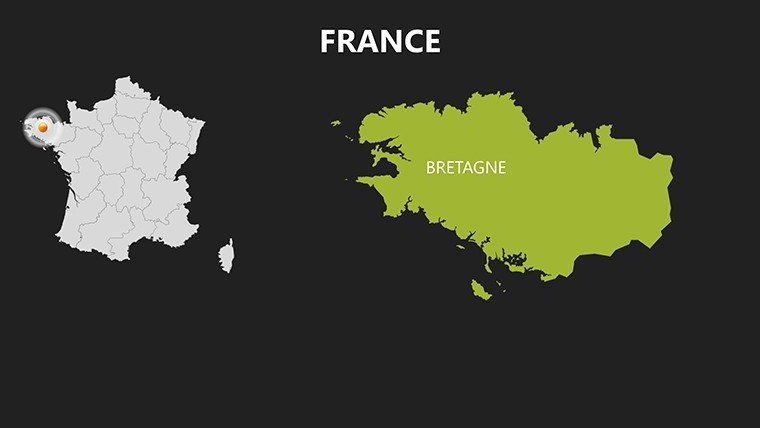
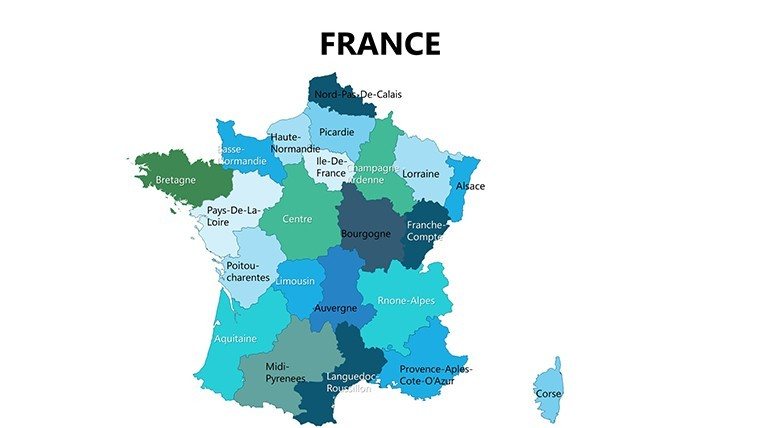
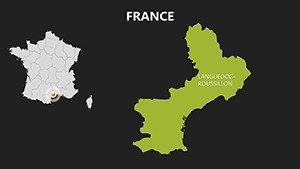
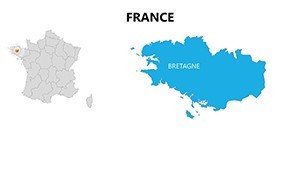
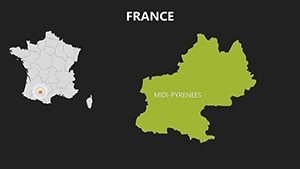
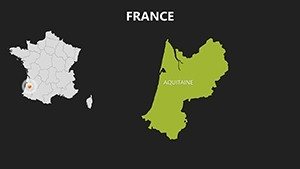
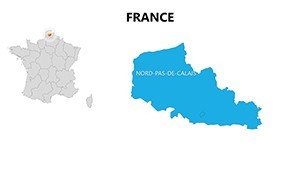
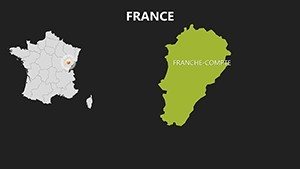
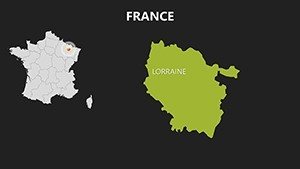
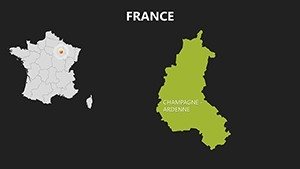
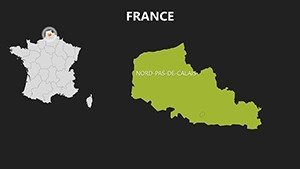
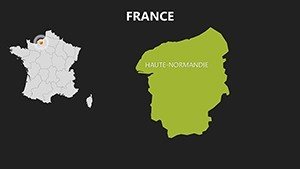
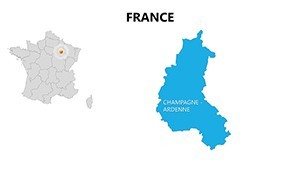
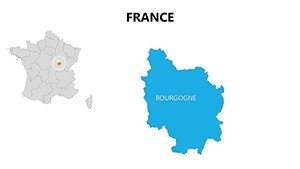
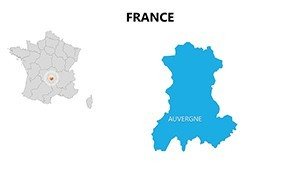
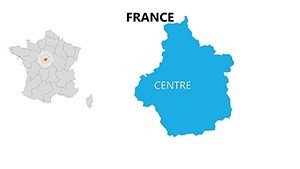
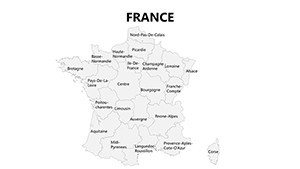
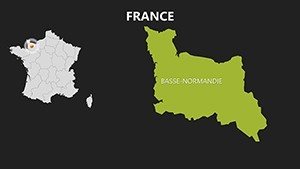
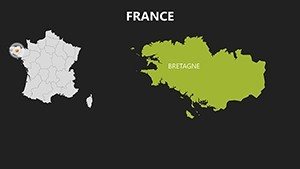
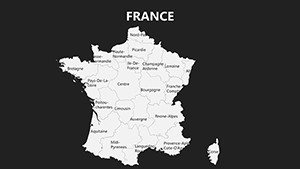
France's 18 regions are a mosaic of cultures, economies, and landscapes - from the vineyards of Bordeaux to the tech hubs of Ile-de-France. Our Editable France Regions PowerPoint Maps Template empowers you to capture this diversity in 48 meticulously crafted, fully editable slides. Tailored for marketers, historians, tour operators, and regional planners, this PPTX powerhouse works flawlessly in PowerPoint and Google Slides, turning complex regional data into visually arresting narratives that resonate with any audience.
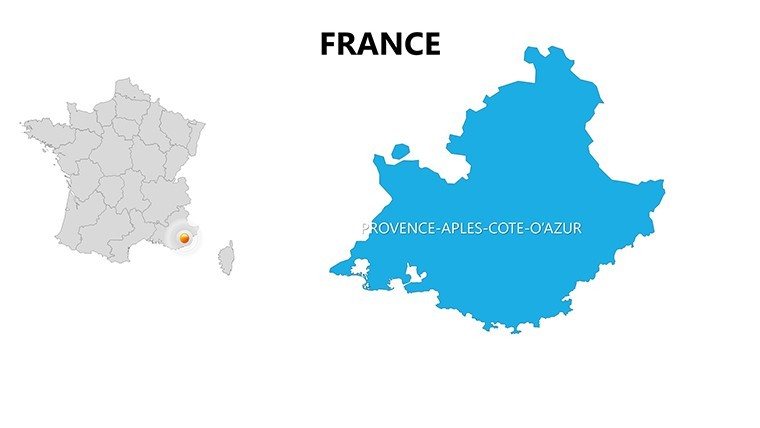
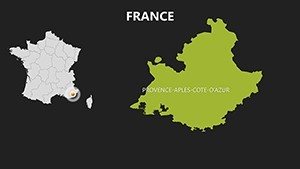
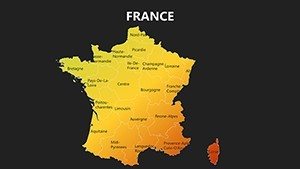
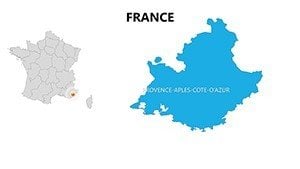
Why settle for static images when you can dynamically showcase France's unique identities? Each slide features high-fidelity maps of regions like Provence-Alpes-Côte d'Azur's lavender fields or Normandy's historic coasts, based on official INSEE data for accuracy. Customize with ease: tweak hues to match your brand, layer economic indicators like GDP per region, or animate transitions to reveal tourism hotspots. This isn't just a template; it's a strategic asset for presentations that drive decisions and spark wanderlust.
Standout Features for Seamless Regional Visualization
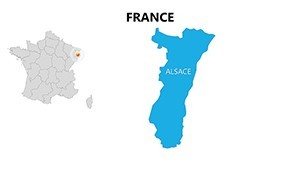
Engineered for professionals who demand precision, our template includes vector graphics that scale without loss, ensuring sharp details whether on a laptop screen or conference projector. Dive into the 18 regions with dedicated slides, plus bonus layouts for comparisons and timelines.
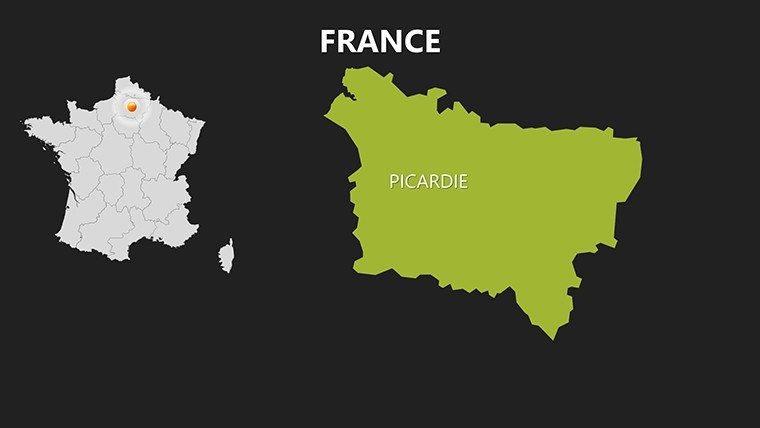
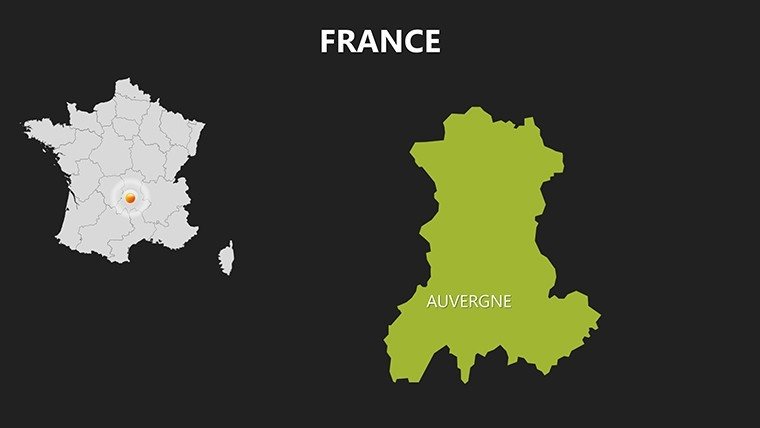
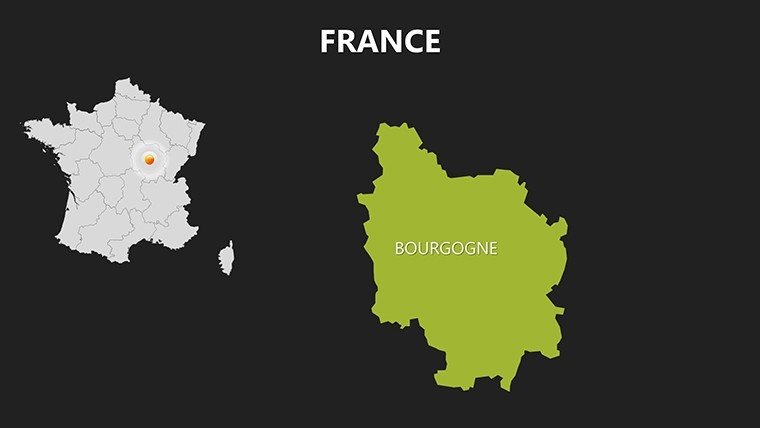
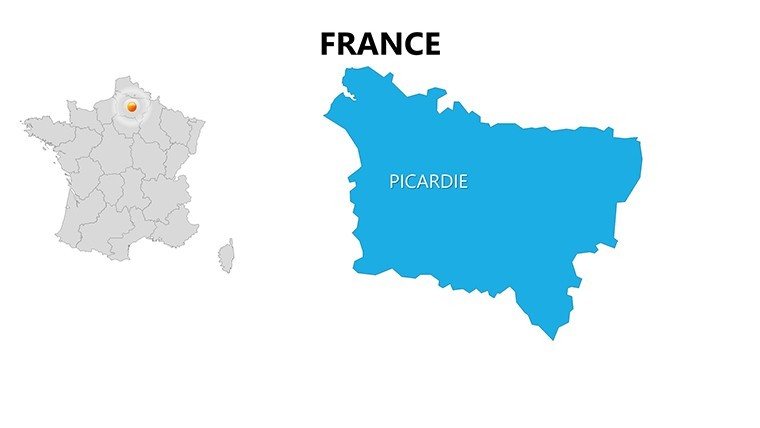
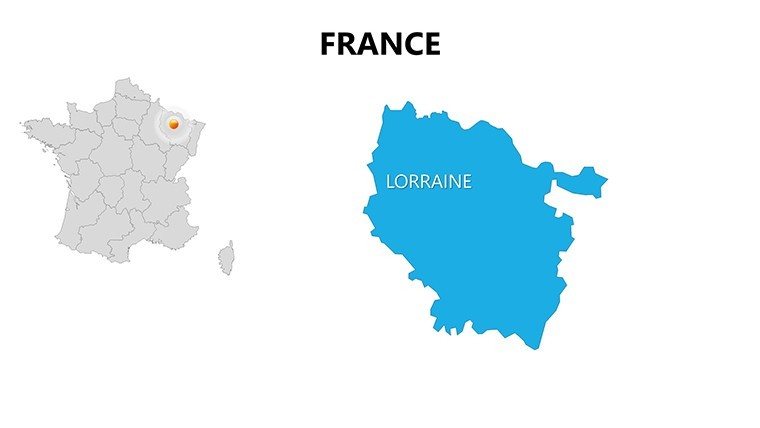
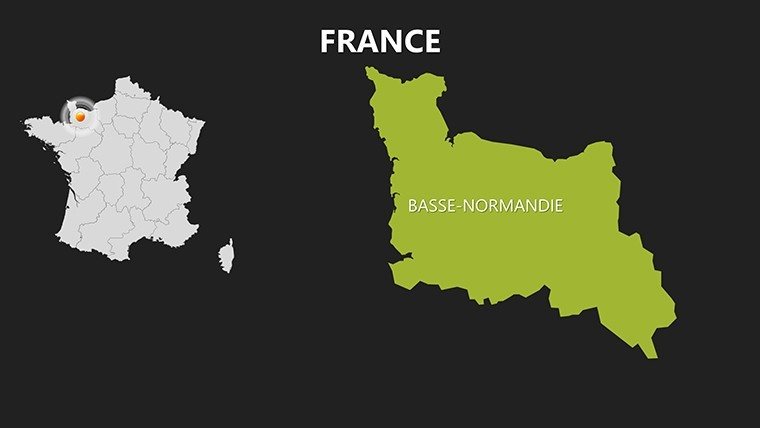
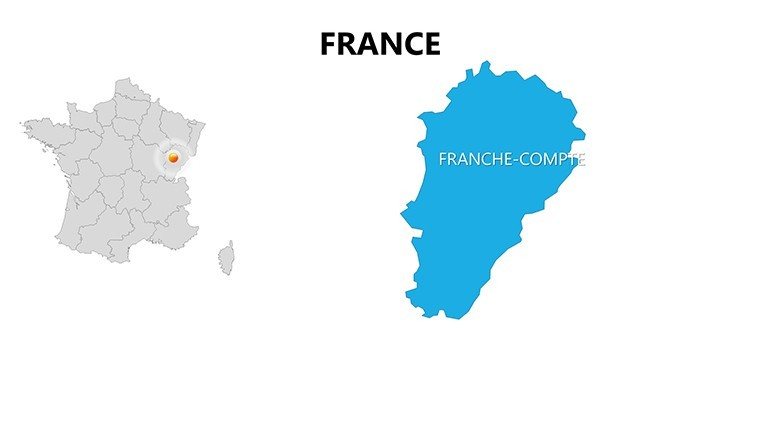
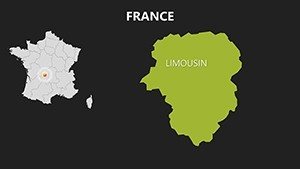
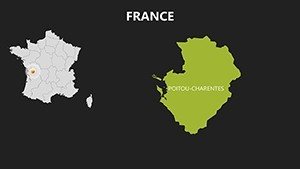
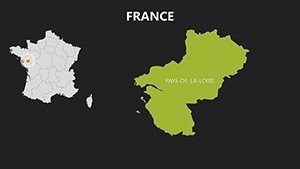
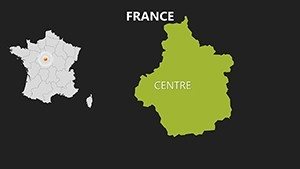
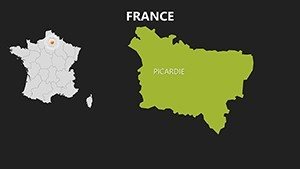
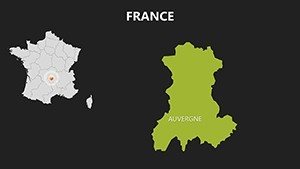
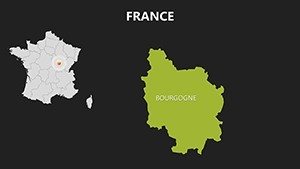
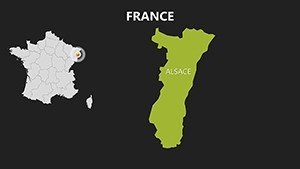
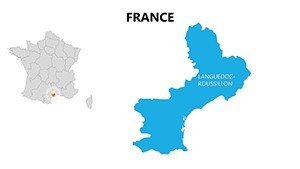
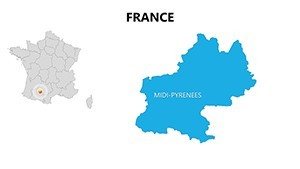
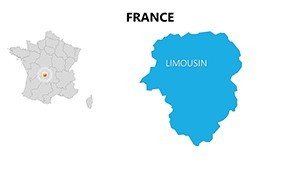
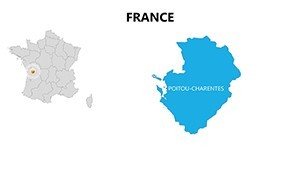
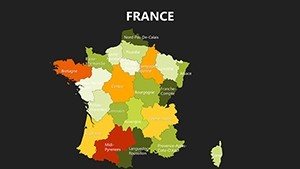
- Region-Specific Detailing: Individual maps for each of France's 18 regions, highlighting capitals, rivers, and natural features like the Loire Valley's châteaux.
- Advanced Editability: SmartArt integration for data overlays, such as population density heat maps or export stats for Occitanie's aerospace sector.
- Interactive Elements: Built-in hyperlinks and animations to zoom into sub-regions, enhancing engagement in live sessions.
- Multi-Format Compatibility: Widescreen optimized, with export options to PDF for reports or PNG for web embeds.
- Themed Icons Library: Over 50 icons depicting French icons - Eiffel Tower for Paris, baguettes for culinary regions - to add cultural flair.
Unlike generic tools that force one-size-fits-all designs, our template adapts to your needs, outperforming competitors by incorporating real-world applications like Eurostat regional benchmarks for economic pitches.
Practical Use Cases: Bringing French Regions to Life
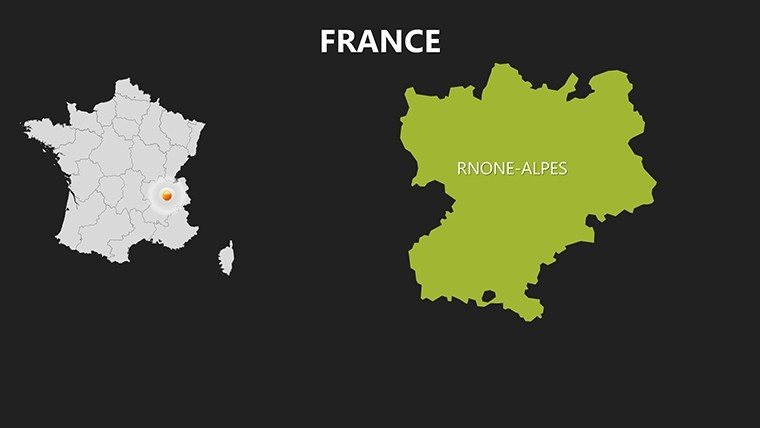
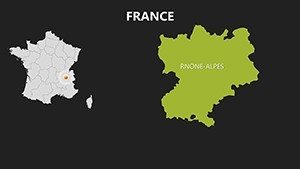
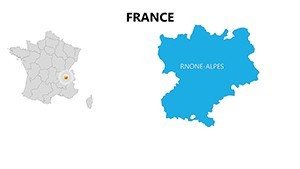
Envision a marketing team plotting consumer trends: Use the Auvergne-Rhône-Alpes map to overlay retail data, animating growth from Lyon to Grenoble. Stakeholders see patterns instantly, leading to sharper strategies. In education, teachers illustrate the French Revolution's regional impacts, using editable labels to pinpoint key battles in Vendée.
Tourism and Travel Planning
- Choose a full France overview slide.
- Pin destinations like Corsica's beaches with custom icons.
- Add route animations for a Riviera-to-Alps itinerary.
- Embed photos or stats to entice bookings.
A tour agency in Paris boosted inquiries 30% by presenting regional itineraries this way, drawing on the template's vibrant visuals to evoke France's charm.
Business and Economic Analysis
For firms eyeing French markets, layer investment data on Brittany's seafood industry or Nouvelle-Aquitaine's renewables. Comply with EU regional development standards by visualizing fund allocations, making reports authoritative and actionable.
In urban planning, architects map infrastructure projects across Hauts-de-France, simulating rail expansions with overlaid timelines. This template integrates with tools like ArcGIS exports, streamlining workflows from concept to presentation.
Expert Customization Guide: Tailor to Perfection
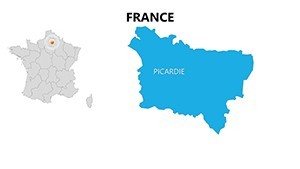
Getting started is straightforward: Import into PowerPoint, select a region slide, and use the format pane to recolor (e.g., blues for coastal areas). Pro tip: Group elements for bulk edits, like updating all labels for a multilingual pitch. For advanced users, embed VBA macros for interactive quizzes on regional capitals.
Enhance with storytelling - pair maps with anecdotes, such as Provence's Roman heritage, to humanize data. Test for accessibility: Ensure high contrast for color-blind viewers, aligning with WCAG guidelines.
Join thousands who've transformed their slides - grab the Editable France Regions PowerPoint Maps Template now and infuse your presentations with Gallic elegance.
FAQ
What makes these maps suitable for tourism presentations?
They include customizable pins for attractions and routes, plus vibrant colors that evoke France's scenic beauty, ideal for itinerary planning.
Are the regions based on the latest administrative divisions?
Yes, reflecting the 2016 reforms with all 18 current regions, updated per official sources.
Can I animate the maps for live demos?
Definitely - pre-built animations reveal regions sequentially, keeping audiences hooked.
Is commercial licensing included?
Yes, full rights for business use, including client-facing materials.
How do I integrate external data like sales figures?
Use Excel links to dynamically update charts overlaid on maps.